

opendatalab / ChartVerse-Coder

huggingface.co
Total runs: 19
24-hour runs: 0
7-day runs: 10
30-day runs: 10
Model's Last Updated: January 21 2026
text-generation

Introduction of ChartVerse-Coder

Model Details of ChartVerse-Coder

ChartVerse-Coder is a complexity-aware chart code generator that can autonomously synthesize diverse, high-complexity chart codes from scratch, developed as part of the opendatalab/ChartVerse project. For more details about our method, datasets, and full model series, please visit our Project Page .

Unlike prior template-based or seed-conditioned approaches, ChartVerse-Coder generates chart code via high-temperature sampling, enabling broad exploration of the long-tail chart distribution and producing diverse, realistic charts with high structural complexity.
🔥 Highlights
  • Autonomous Synthesis : Generates diverse chart codes from scratch without templates or seed charts
  • Complexity-Aware : Trained with RPE-guided filtering to master high-complexity visualizations
  • High Diversity : Produces charts spanning 3D plots, hierarchical structures, multi-subplot layouts, and more
  • Iterative Self-Enhancement : Progressively improves code quality through generation-filtering-retraining loops
🔬 Method Overview
Rollout Posterior Entropy (RPE)
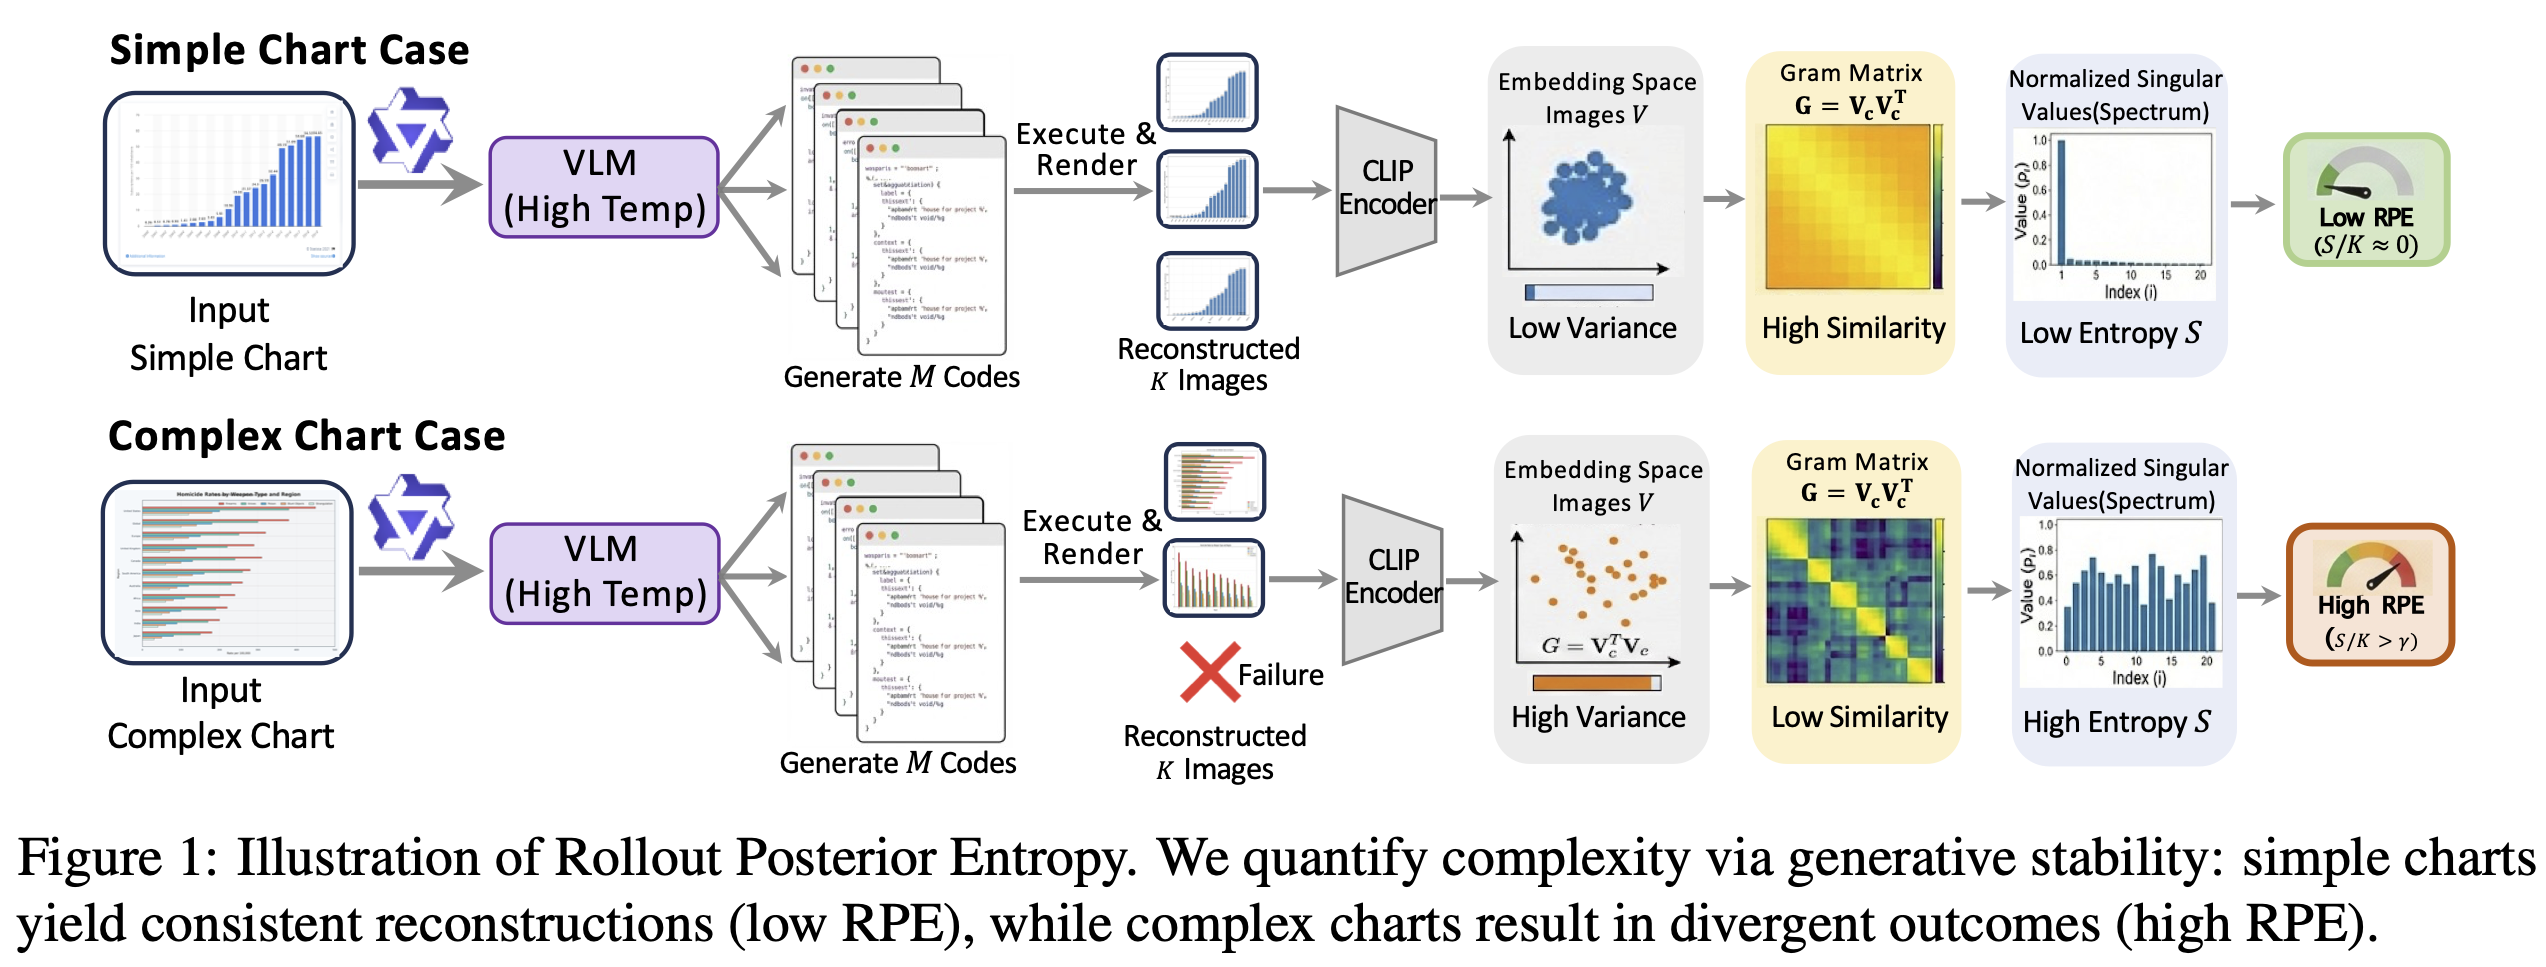
RPE Illustration

We propose Rollout Posterior Entropy (RPE) to quantify intrinsic chart complexity via generative stability:

  1. VLM Rollout : Given a chart, prompt a VLM to generate executable code 8 times with temperature 1.0
  2. Feature Extraction : Extract CLIP embeddings from reconstructed images and compute Gram matrix
  3. Spectral Entropy : Calculate entropy from normalized singular values

Key Insight : Simple charts yield consistent reconstructions (low RPE), while complex charts result in divergent outcomes (high RPE). We retain only samples with RPE ≥ 0.4 .
Training Pipeline
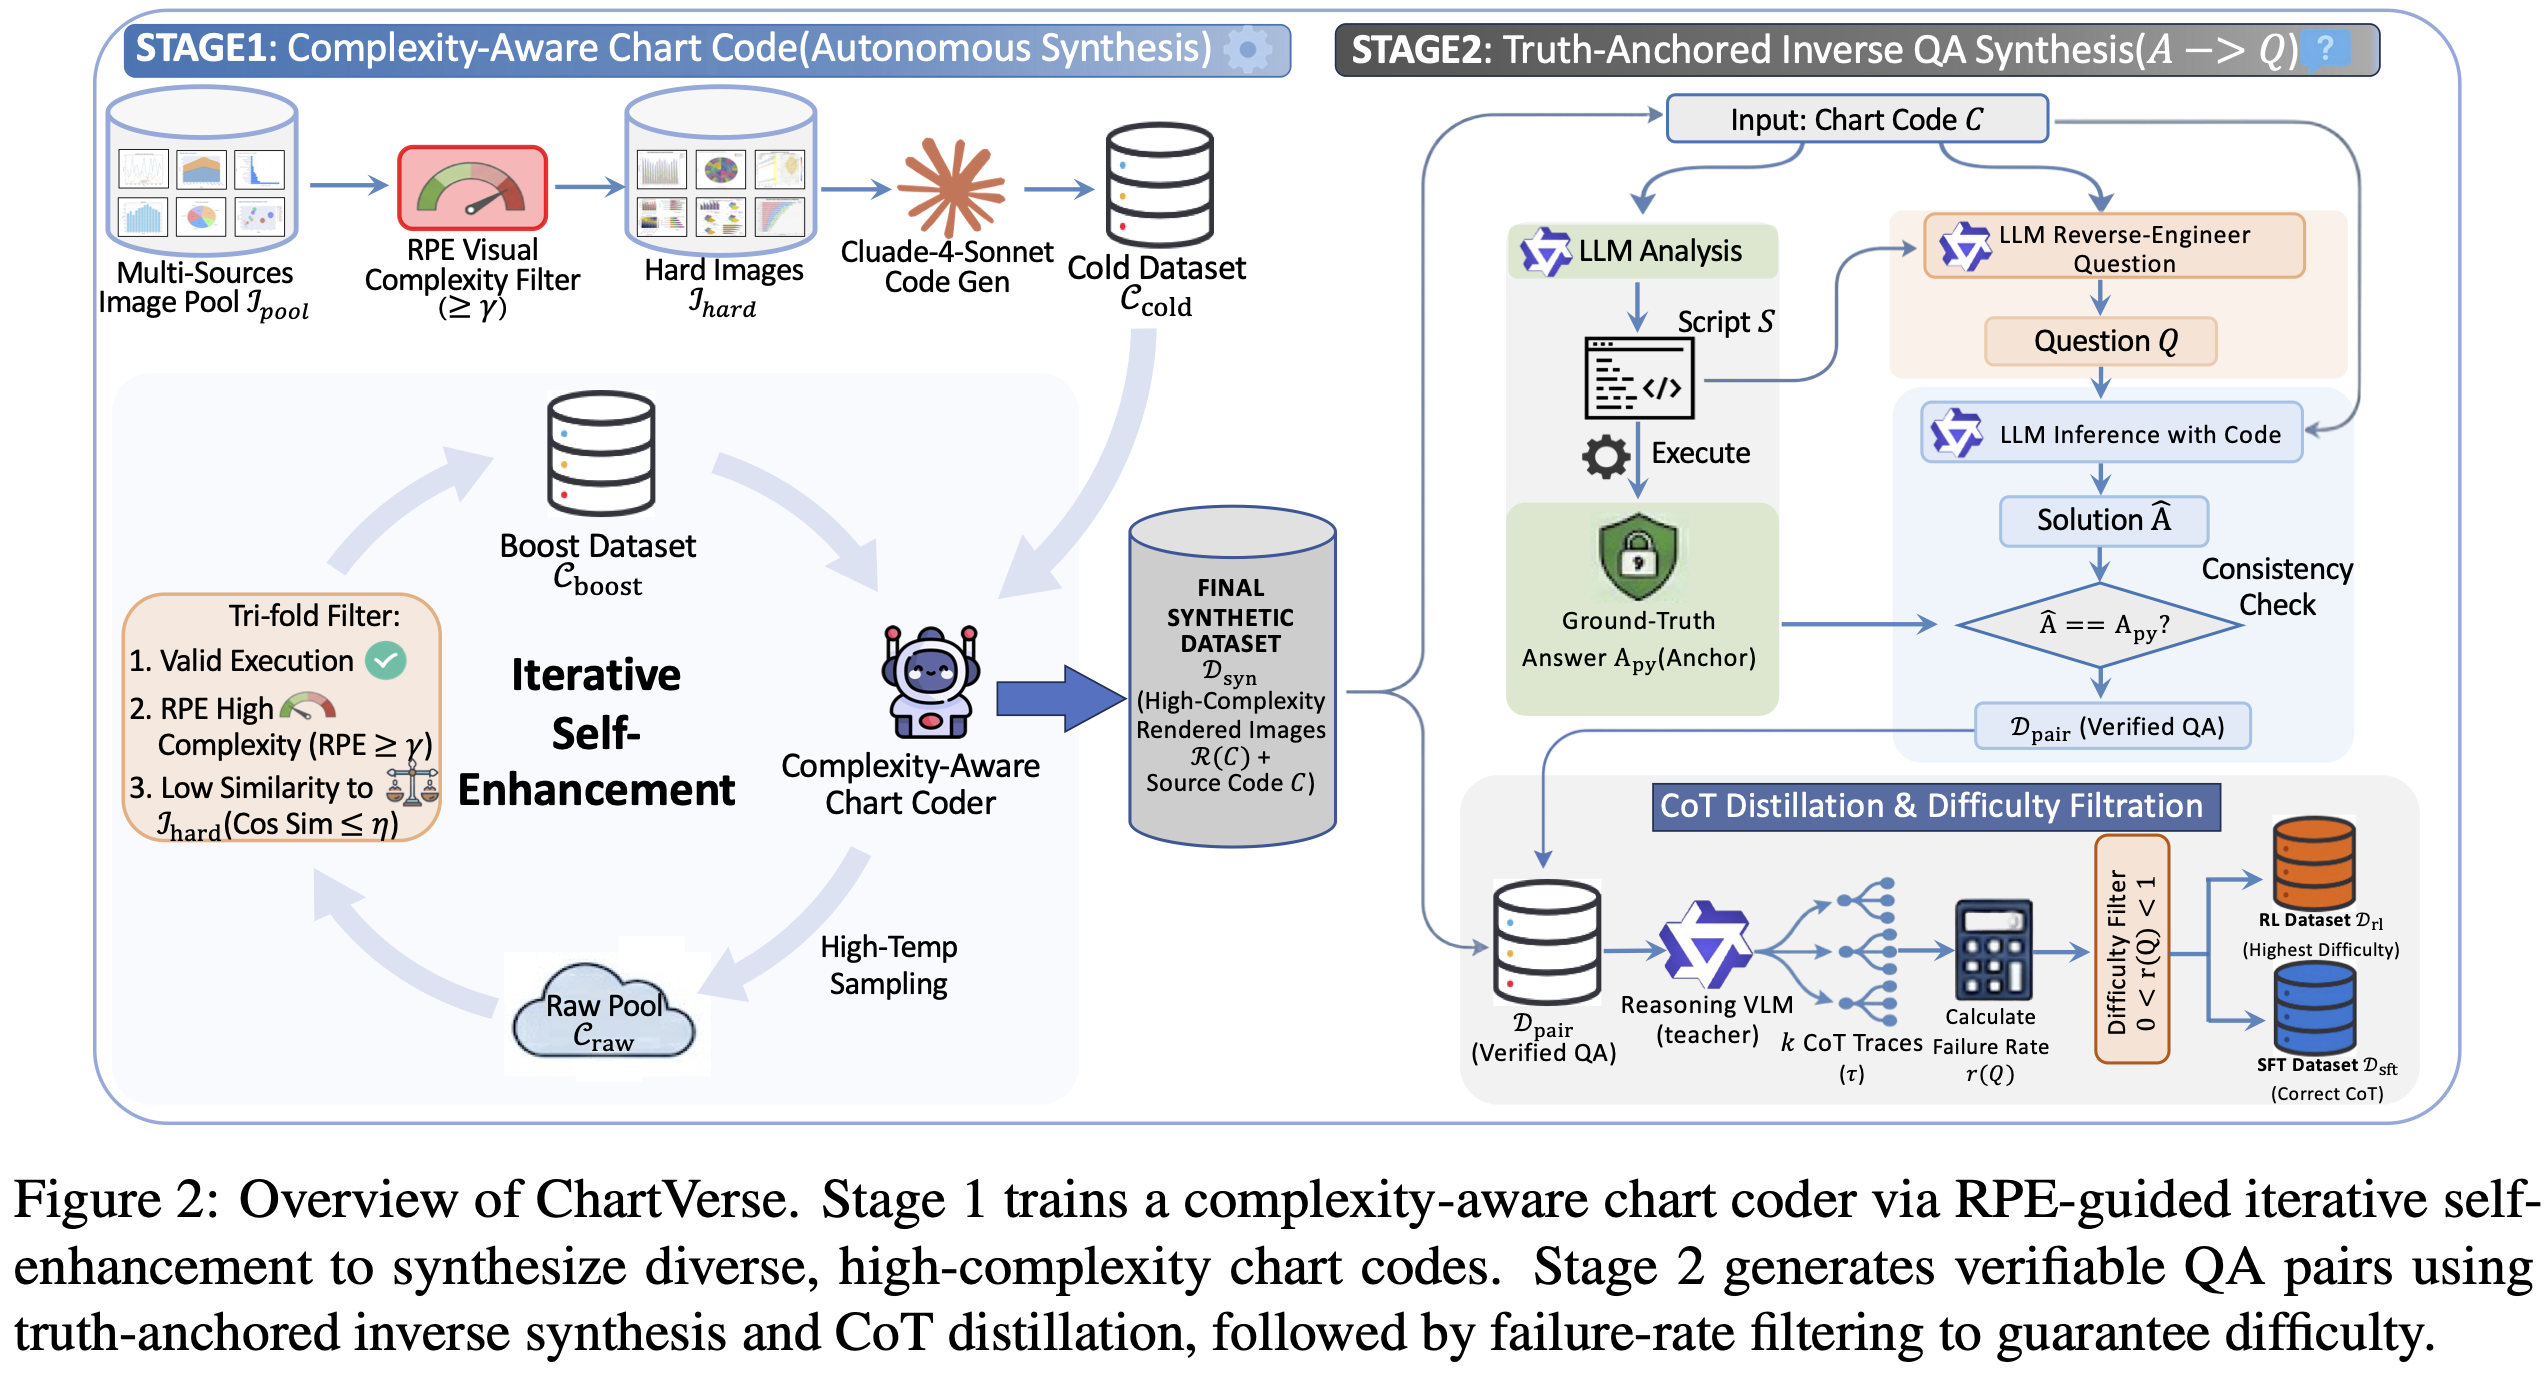
ChartVerse Pipeline

Stage 1: Difficulty-Filtered Cold Start

  • Aggregate charts from existing datasets and filter by RPE ≥ 0.4
  • Use Claude-4-Sonnet to infer source code for high-complexity charts
  • Curate 60K high-quality seed samples

Stage 2: Iterative Self-Enhancement

  • Generate 2M raw candidates via high-temperature sampling
  • Apply tri-fold filtering:
    • ✅ Valid Execution
    • ✅ High Complexity (RPE ≥ 0.4)
    • ✅ Low Similarity to existing data (Cosine Sim ≤ 0.65)
  • Retrain coder on expanded dataset
  • Repeat for 2 iterations

Final Output : Generate 1M high-complexity chart code samples for downstream QA synthesis.
🏋️ Training Details
  • Base Model : Qwen2.5-Coder-7B-Instruct
  • Cold Start Data : 60K high-complexity samples
  • Boost Data : 200K iteratively filtered samples
  • Training : Full-parameter fine-tuning with LLaMA-Factory
  • Learning Rate : 2.0 × 10⁻⁵
  • Batch Size : 16
  • Context Length : 4,096 tokens
  • Epochs : 5
  • Precision : BF16
📊 Synthesized Data Quality
Comparison with Existing Datasets
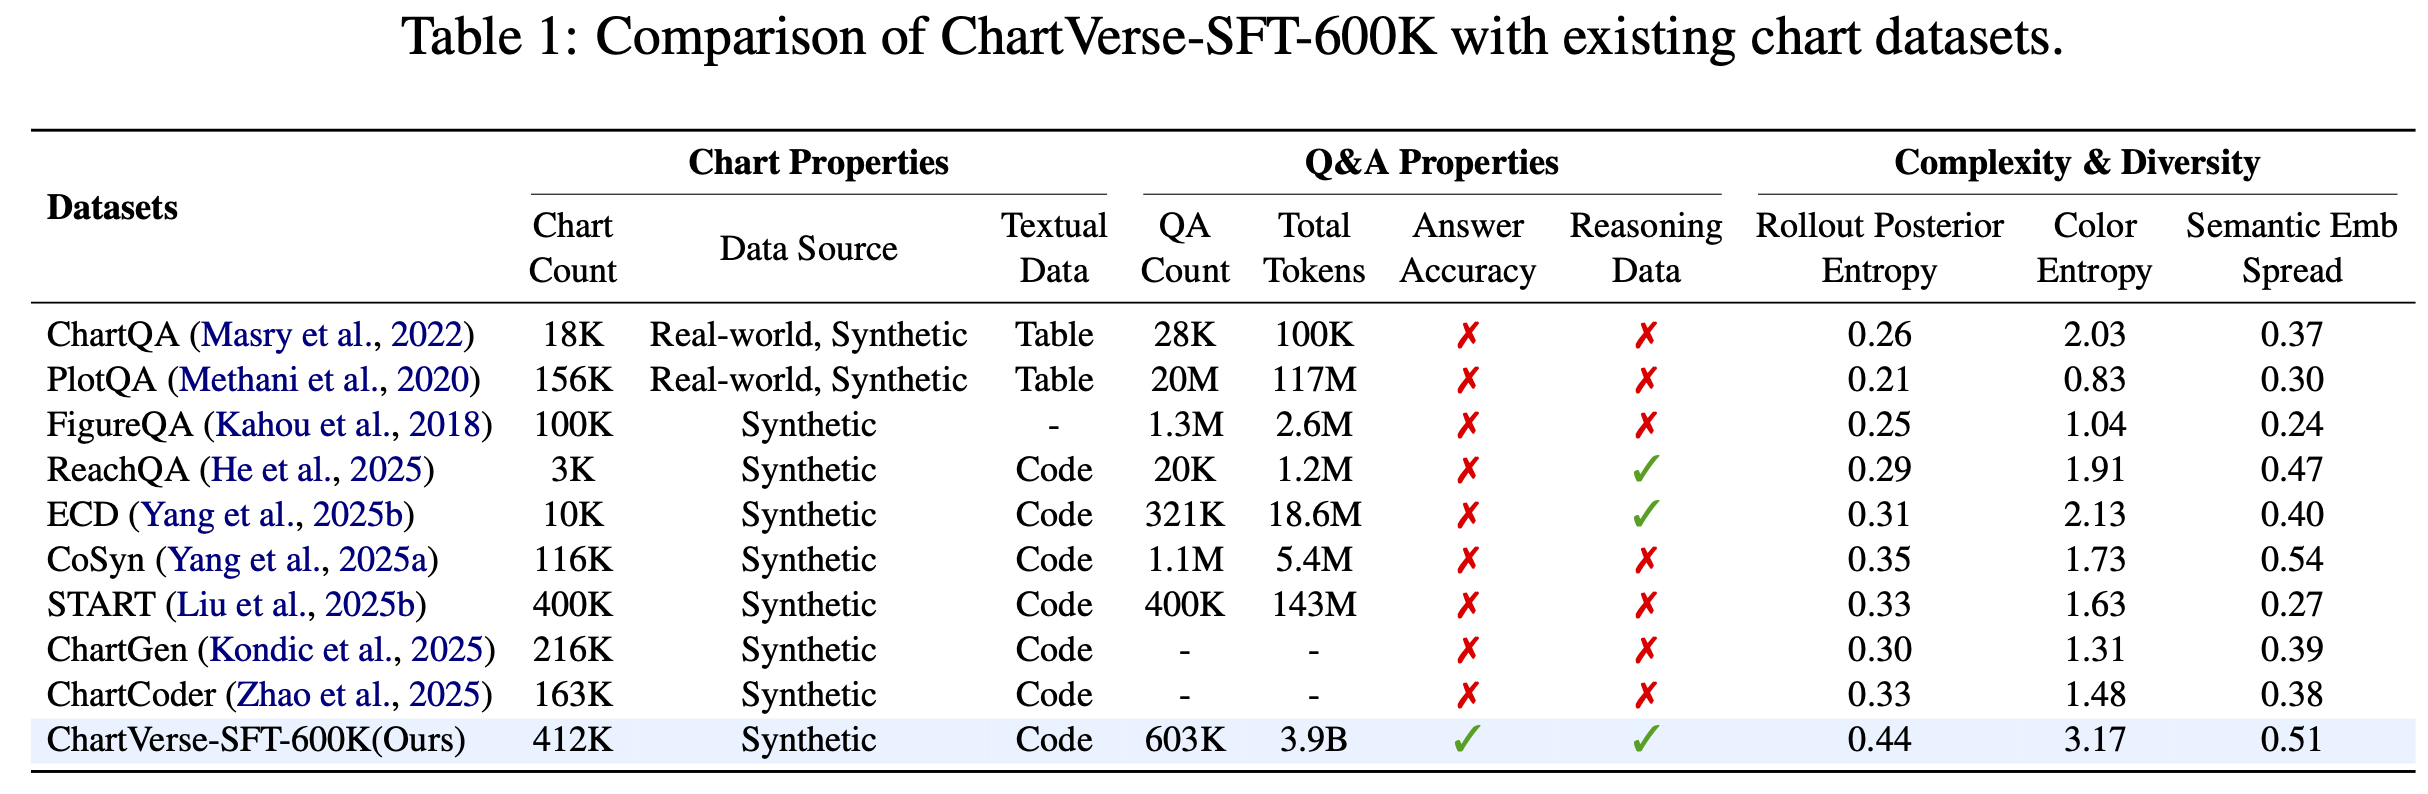
Dataset Comparison

ChartVerse-Coder synthesizes charts with significantly higher complexity and diversity than all existing datasets.
Synthesized Chart Examples
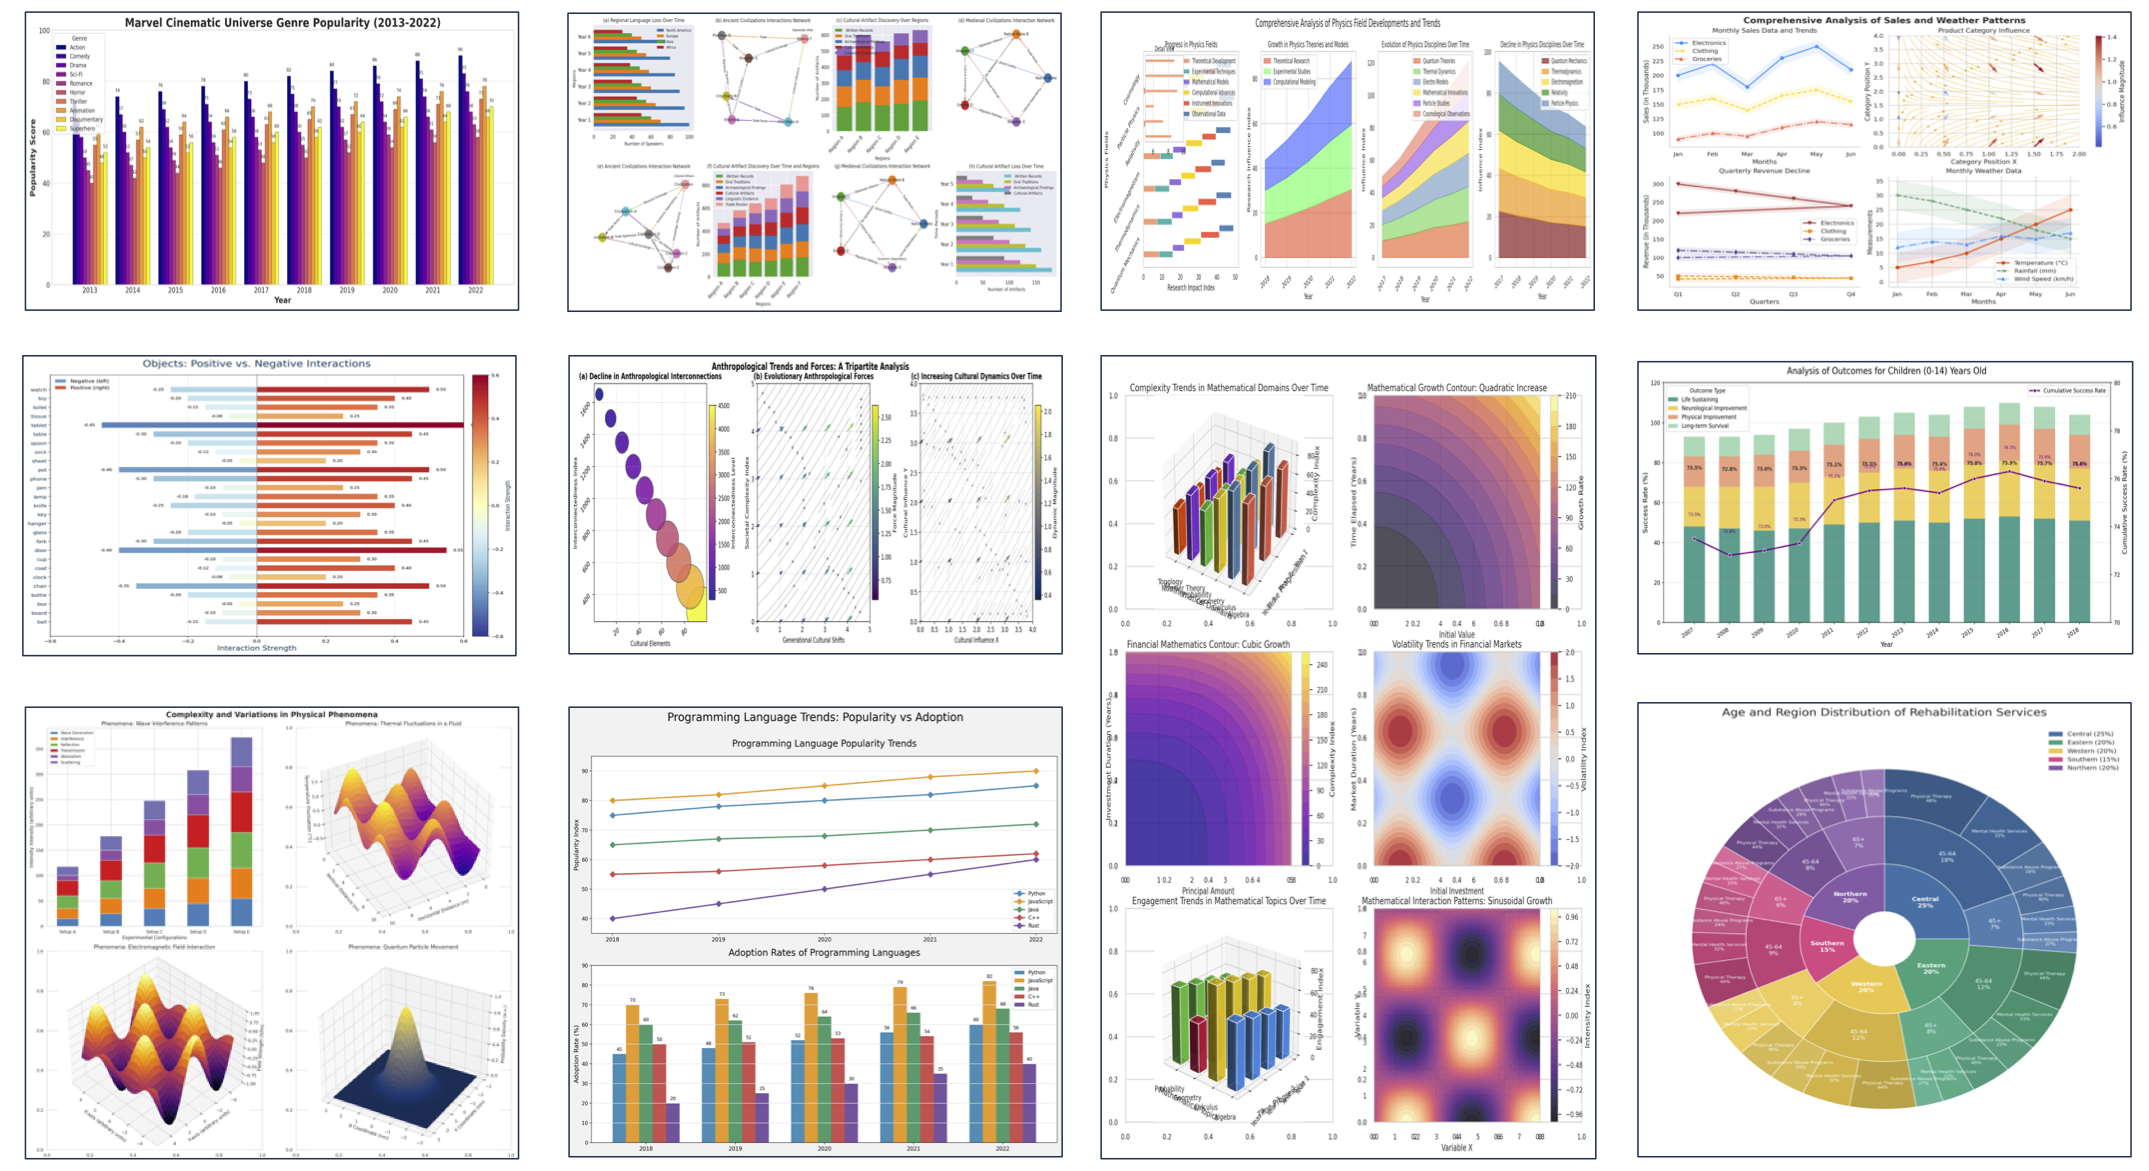
Complex Chart Examples

Our synthesized charts demonstrate exceptional diversity:

  • 3D Visualizations : Surface plots, 3D bar charts, scatter plots
  • Hierarchical Structures : Treemaps, sunburst charts, dendrograms
  • Statistical Plots : Violin plots, radar charts, box plots with annotations
  • Multi-Subplot Layouts : Complex dashboards with mixed chart types
  • Specialized Charts : Sankey diagrams, chord diagrams, heatmaps with clustering
🚀 Quick Start
from transformers import AutoModelForCausalLM, AutoTokenizer

# Load Model
model_path = "opendatalab/ChartVerse-Coder"
model = AutoModelForCausalLM.from_pretrained(
    model_path, torch_dtype="auto", device_map="auto"
)
tokenizer = AutoTokenizer.from_pretrained(model_path)

# System Prompt
prompt = """You are a Python visualization expert. Generate a random Python visualization code focusing on charts, tables, or diagrams.

Requirements:
- Choose any visualization type (chart, table, flowchart, diagram, etc.)
- Create sample data
- Use Python visualization library (matplotlib, graphviz, etc.)
- Make it visually appealing with proper labels, titles, and colors
- Include sufficient visual elements
- Carefully design the layout to avoid any overlapping text or elements
- Adjust figure size, margins, and spacing for optimal clarity
- Make it visually appealing with proper labels, titles, and colors

Output format: Only output the Python visualization code wrapped in ```python```
"""

# Generate Chart Code
messages = [
    {"role": "user", "content": prompt}
]

text = tokenizer.apply_chat_template(messages, tokenize=False, add_generation_prompt=True)
inputs = tokenizer(text, return_tensors="pt").to("cuda")

# High-temperature sampling for diversity
outputs = model.generate(
    **inputs,
    max_new_tokens=4096,
    temperature=1.0,
    top_p=0.95,
    top_k=20,
    do_sample=True
)

generated_code = tokenizer.decode(outputs[0], skip_special_tokens=True)
print(generated_code)
Execute Generated Code
import re
import matplotlib.pyplot as plt

# Extract code from response
code_match = re.search(r'```python\n(.*?)```', generated_code, re.DOTALL)
if code_match:
    code = code_match.group(1)
    exec(code)  # This will save the figure as 'image.png'
📖 Citation
@article{chartverse2026,
  title={ChartVerse: Scaling Chart Reasoning via Reliable Programmatic Synthesis from Scratch},
  author={Anonymous Authors},
  journal={Anonymous ACL Submission},
  year={2026}
}
📄 License

This model is released under the Apache 2.0 License.

🙏 Acknowledgements

Runs of opendatalab ChartVerse-Coder on huggingface.co

19
Total runs
0
24-hour runs
1
3-day runs
10
7-day runs
10
30-day runs

More Information About ChartVerse-Coder huggingface.co Model

More ChartVerse-Coder license Visit here:

https://choosealicense.com/licenses/apache-2.0

ChartVerse-Coder huggingface.co

ChartVerse-Coder huggingface.co is an AI model on huggingface.co that provides ChartVerse-Coder's model effect (), which can be used instantly with this opendatalab ChartVerse-Coder model. huggingface.co supports a free trial of the ChartVerse-Coder model, and also provides paid use of the ChartVerse-Coder. Support call ChartVerse-Coder model through api, including Node.js, Python, http.

opendatalab ChartVerse-Coder online free

ChartVerse-Coder huggingface.co is an online trial and call api platform, which integrates ChartVerse-Coder's modeling effects, including api services, and provides a free online trial of ChartVerse-Coder, you can try ChartVerse-Coder online for free by clicking the link below.

opendatalab ChartVerse-Coder online free url in huggingface.co:

https://huggingface.co/opendatalab/ChartVerse-Coder

ChartVerse-Coder install

ChartVerse-Coder is an open source model from GitHub that offers a free installation service, and any user can find ChartVerse-Coder on GitHub to install. At the same time, huggingface.co provides the effect of ChartVerse-Coder install, users can directly use ChartVerse-Coder installed effect in huggingface.co for debugging and trial. It also supports api for free installation.

ChartVerse-Coder install url in huggingface.co:

https://huggingface.co/opendatalab/ChartVerse-Coder

Url of ChartVerse-Coder

ChartVerse-Coder huggingface.co Url

Provider of ChartVerse-Coder huggingface.co

opendatalab
ORGANIZATIONS

Other API from opendatalab

huggingface.co

Total runs: 724
Run Growth: -487
Growth Rate: -67.27%
Updated:December 03 2025