































Table of Contents
- Key Points
- Introduction to Interactive Maps with ChatGPT and Folium
- Generating the Python Script with ChatGPT
- Running the Python Script
- Pros and Cons of Using ChatGPT for Map Creation
- FAQ
- Related Questions


Introduction to Interactive Maps with ChatGPT and Folium
The Power of Interactive Maps
Interactive maps are powerful tools for data visualization. Unlike static maps, they allow users to explore data dynamically, zoom in on specific regions, and interact with individual map elements. This enhances user engagement and provides a more intuitive understanding of spatial relationships. Interactive maps have applications in various fields, from urban planning and environmental monitoring to real estate and tourism.
Why Use ChatGPT for Map Creation?
ChatGPT, a large language model, can generate code based on natural language instructions. By providing clear prompts, you can instruct ChatGPT to write Python scripts for creating interactive maps. This approach simplifies the map creation process, making it accessible to individuals with limited coding expertise. It's particularly useful for automating repetitive tasks and generating customized maps quickly. The key is effectively crafting your Prompt to produce optimized results.
Folium: A Python Library for Interactive Maps
Folium is a Python library built on top of Leaflet.js, a leading open-source JavaScript library for mobile-friendly interactive maps. Folium makes it easy to visualize data that's been manipulated in Python on an interactive Leaflet map. It enables you to create maps with various features, including markers, pop-ups, and custom layers. With Folium, you can create visually appealing and highly interactive maps that can be easily embedded in web pages.
Generating the Python Script with ChatGPT
Crafting the Perfect Prompt
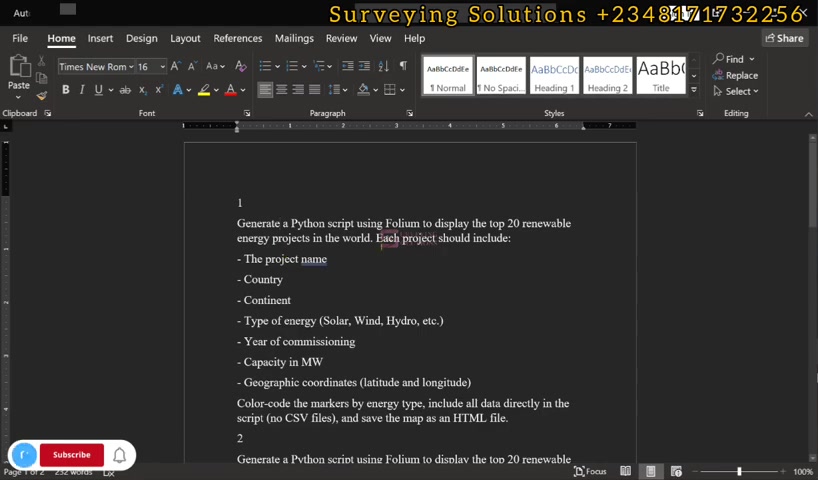
Prompt engineering is crucial for obtaining desired results from ChatGPT. The more detailed and specific your prompt, the better the generated code will be. For instance, if you need a map displaying the top 20 renewable energy projects worldwide, your prompt should include details such as the project name, country, continent, type of energy, year of commissioning, capacity, and geographic coordinates.
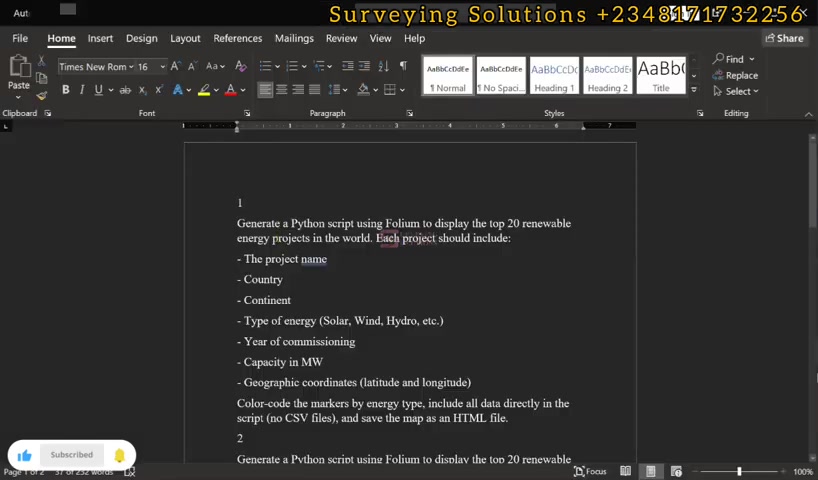
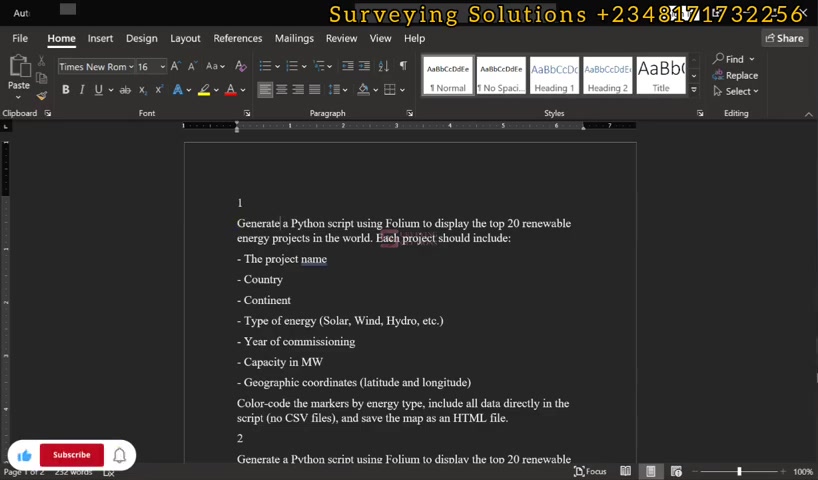
Here's an example of a well-crafted prompt:
Generate a Python script using Folium to display the top 20 renewable energy projects in the world. Each project should include: project name, country, continent, type of energy (Solar, Wind, Hydro, etc.), year of commissioning, capacity in MW, geographic coordinates (latitude and longitude). Color-code the markers by energy type, include all data directly in the script (no CSV files), and save the map as an HTML file.
By including all these details in your prompt, you guide ChatGPT to generate a comprehensive and accurate Python script. The prompt also specifies the need to color-code markers based on the energy type, enhancing the map's visual appeal and usability.
Copying and Pasting the Prompt into ChatGPT
Once you've crafted your prompt, copy and paste it into the ChatGPT interface. To optimize the process, enable features such as 'Search the web' and 'Think before responding.' This allows ChatGPT to access real-time information and refine its output. Click the run button, and ChatGPT will generate the Python script based on your prompt.
Tools and features to use:
- Add photos and files
- Search the web
- Think before responding
- Get detailed report
- Visualize anything
- Collaborate
Understanding the Generated Python Script
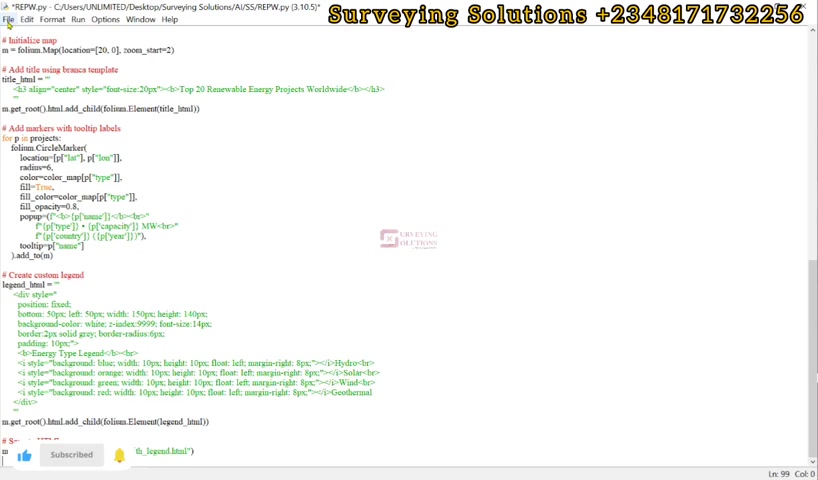
ChatGPT provides the Python script, which uses the Folium library to create an interactive map displaying renewable energy projects. The script includes:
- Importing the Folium library
- Data for the top 20 renewable energy projects, including their names, countries, continents, energy types, years of commissioning, capacities, and geographic coordinates.
- Color-coding for different energy types (e.g., hydro, solar, wind, geothermal).
- Initialization of the Folium map and addition of markers for each renewable energy project.
The script saves the interactive map as an HTML file, making it easily accessible and shareable.
Running the Python Script
Installing Folium
Before running the script, ensure Folium is installed in your Python environment. You can install it using pip, the Python package installer. Open your command prompt or terminal and type:
pip install folium
If you require additional elements, the command can be:
pip install folium branca
Executing the Script
Once Folium is installed, copy the Python script generated by ChatGPT into a Python file (e.g., renewable_projects_map.py). Open your Python environment and run the script. This will execute the code, create the interactive map, and save it as an HTML file.
Opening the HTML Map File
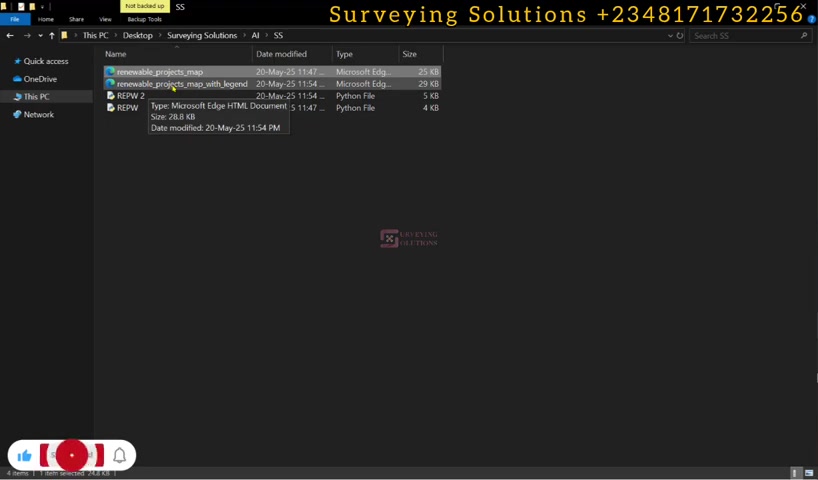
After running the script, an HTML file (e.g., renewable_projects_map.html) will be created in the same directory as your Python script. Open this HTML file in any web browser to view the interactive map. You can then zoom in, explore the map, and interact with the markers to learn more about each renewable energy project.








Most people like


































Report
Please select a reason for reporting
- 13 Reasons to Switch from Snapchat to Text Messaging
- 7 Powerful Speech to Text Apps to Boost Productivity
- 10 Best Speech to Text Tools for Effortless Transcription
- 13 Free Tools to Easily Transcribe Audio to Text
- 15 Surprising Ways Google's Speech-to-Text Boosts Productivity
- 7 Best Free Online Audio to Text Transcription Tools
- 9 Tips to Transcribe Speech to Text Faster and Better
- 13 Best Speech to Text Software for Windows 10 in 2023
- 7 Tips for Choosing the Best Transcriber for Audio to Text
- 11 Reasons Why Dragon Speech-to-Text Apps are Game-Changers
- 6 Secrets to Enhance Your Speech to Text Transcription
- 6 Brilliant Ways to Boost Productivity with Talk-to-Text on Your MacBook
- 6 Ways Transcription Software Converts Audio to Text
- 8 Tips to Transcribe Speech to Text Like a Pro
- 6 Reasons IBM Watson Speech to Text is a Game-Changer
- 14 Powerful Ways Talk-to-Text Improves Your Workflow
- 12 Top Windows Speech-to-Text Software for Efficient Transcription
- 12 Game-Changing Benefits of Apple's Speech to Text Technology
- 9 Powerful Use Cases for AWS Speech to Text Technology
- 10 Easy Steps to Transcribe YouTube Videos to Text
- transcription audio en texte
- online audio transcription
- free audio file transcription
- free ai audio transcription
- audio transcription service
- audio transcription online free
- audio transcription free online
- audio to transcription software
- audio and transcript
- ai audio transcription free
- voice recording to text converter
- translate voice recording to text
- record voice to text
- audio recording to text converter
- voice recording and transcription
- chatgpt voice to text
- gmail voice to text
- speech to text reader
- speech to text ai free
- speech to talk
- How SEO and Marketing Dashboards Empower Agencies to Drive Results
- How to Use AI Tools to Find Internal Linking Opportunities Across a Business Website
- Discover Your Perfect Haircut with AI Hairstyle Apps
- Free Reputation Calculator Tools: How They're Adapting to Score AI Visibility, Not Just Rankings
- Design Professional Flyers for Free on Your Phone
- Best Free Flyer Maker Apps for Android: Design Like a Pro
- How to Know If Your Business Is Ready for an AI Customer Service Agent
- Revolutionizing Storytelling: From Novels to Screenplays with AI
- Create Engaging Animated Explainer Videos with a Free AI Tool
- Stop Multi-Subscribing: Benchmark Top AI Visual Models in One Canvas
- ASOMobile Helps Teams Benchmark App Store Screenshots Against Competitors
- How to Match LMS Software With Your Organization's Training Plan
- Revolutionizing Email Marketing Agency with AI
- How to Convert BTC to HNT
- Unleashing the Power of AI: Cognizant's Roadmap for Transformation
- Frame to Video Review: A Practical Look at Turning Two Still Frames Into Motion
- NVIDIA NIM: Revolutionizing Supply Chain Data Analysis with AI
- Top AI Tools That Help Brands Stand Out Offline (Not Just Online)
- Top 5 Cold Email Software: Maximize Your Outreach in 2025
- Magic School AI: Revolutionizing Quiz & Assessment Generation

Copyright ©2026 toolify