































Table of Contents
- Key Points
- Understanding Feedback in Music Recommendation Systems
- The Piki Music Dataset: A Unique Approach
- Using WRMF Algorithm with Likes and Dislikes
- Piki Music Dataset Metrics on various stake holders
- Weighing the Balance: WRMF on Likes vs. Likes & Dislikes
- Stakeholder Centered Evaluation
- Use Cases for the Piki Music Dataset
- FAQ
- Related Questions



Understanding Feedback in Music Recommendation Systems
The Challenge of Explicit Feedback Datasets: Self-Selection Bias
Explicit feedback datasets, commonly found on platforms like YouTube
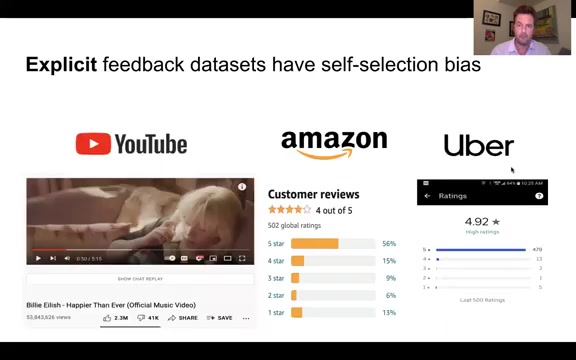
, Amazon, and Uber, present a significant challenge due to self-selection bias. This bias arises because users are consciously providing ratings or reviews, and their decision to do so is often influenced by their strong opinions—either very positive or very negative. This means the available data may not accurately represent the preferences of the general user base.
Consider YouTube, where a Music video might have millions of views , but only a fraction of viewers actively engage by liking or disliking the video. Similarly, on Amazon, customers are more likely to leave a review if they are exceptionally pleased or disappointed with a product. These ratings are often biased, skewing the overall perception of the quality or relevance of items being recommended.
This bias has implications for the training and evaluation of music recommendation systems. If a system is trained primarily on explicit feedback, it may disproportionately cater to the vocal minority, potentially overlooking the preferences of the less engaged majority.
Key Takeaways:
- Explicit feedback data is readily available but often skewed.
- Self-selection bias can lead to inaccurate representations of user preferences.
- Relying solely on explicit feedback may limit the diversity and relevance of recommendations.
The Noisy Reality of Implicit User-Item Datasets
Implicit user-item datasets, which track user behavior without explicit feedback (e.g., plays, skips, shares), offer an alternative but come with their challenges
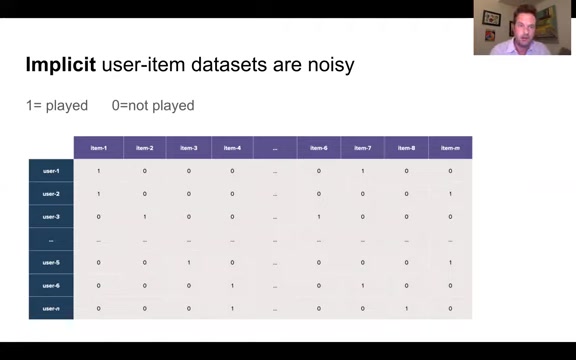
. A core issue is the presence of noise in the data. For instance, in a music streaming service, a track might be automatically added to a user's playlist or played passively without genuine endorsement. A song may have just been passively played in a playlist and may not be an endorsement of the song.
In an implicit dataset, a '1' often indicates that a user has played an item, while a '0' suggests it was not played. The interpretation of '0' is complex because it may mean the user dislikes the item or that they simply have not encountered it.
The result is a dataset skewed towards '0s', creating an imbalance that poses difficulties for recommendation algorithms. Such algorithms are trained on this type of data set. This dataset leads to the assumption that a song that has not been listened to will not be liked.
Moreover, relying solely on play counts or similar metrics risks reinforcing existing popularity biases, as the algorithm might favor items already trending.
Key Takeaways:
- Implicit datasets, while abundant, can be noisy and unreliable indicators of user preference.
- The interpretation of 'not played' data is ambiguous, leading to potential misrepresentations.
- Imbalanced datasets require careful handling to avoid reinforcing existing biases and filtering bubble risks.
The Piki Music Dataset: A Unique Approach
Understanding the Piki User Interface
To address the shortcomings of both explicit and implicit feedback, innovative data collection methods have emerged
. The Piki user interface (UI) offers one such approach.
The Piki interface is designed to balance the need for explicit feedback with the desire to minimize self-selection bias. Users are presented with snippets of music videos, and their engagement is tracked over time. Crucially, users are not immediately prompted to rate or review the content. This forces the user to evaluate their interest in the music video in a very short time frame.
The Piki interface provides a series of engagement options over time:
- Initial Exposure: Immediately upon seeing the video.
- Skip/Dislike (After 3 seconds): The option to skip if uninterested is available quickly, reducing the risk of passive engagement.
- Like (After 6 seconds): A 'like' indicates moderate interest, demonstrating engagement beyond a fleeting impression.
- Super Like (After 12 seconds): A 'super like' signals strong positive sentiment, differentiating highly favored content.
- Replay (After 30 seconds): Provides an implicit binary feedback dataset, where it is considered if an item is played or not played.
Key Takeaways:
- The Piki interface seeks to bridge the gap between explicit and implicit feedback mechanisms.
- Graduated engagement options provide nuanced insights into user preferences.
- The time-sensitive nature of the interface encourages more deliberate and representative feedback.
Analyzing the Piki Music Dataset: Data Structure and Insights
The data collected through the Piki interface forms the Piki Music Dataset
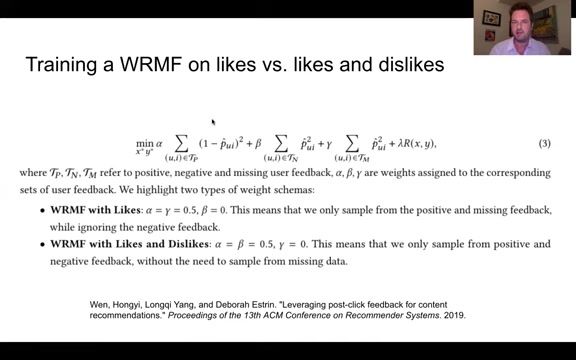
, which offers a rich source of information for evaluating music recommendation algorithms. It’s made of 500,000 rows, and it can be found on the presenter's Github. The Dataset is available to developers.
The dataset comprises the following key elements:
- Timestamp: Records the time of user interaction.
- User ID: Identifies the individual user.
- Song ID: Identifies the specific musical piece.
- Liked: Captures user sentiment as:
- 0 = Dislike (skip).
- 1 = Like.
- 2 = Super Like.
- Personalized: Indicates whether the recommendation was from a personalized or random algorithm (0 for random, 1 for personalized).
- Spotify Popularity: Reflects the artist’s Spotify popularity (0-100, from lesser-known to well-known).
The Piki-ness of a track is correlated with Spotify popularity.
| Header | Content |
|---|---|
| Timestamp | Records the time of the user interaction. |
| User ID | The specific and unique identifier of the user. |
| Song ID | The specific and unique identifier of the music track. |
| Liked | This shows the user's reaction to the track and gives a value for evaluation. 0 = Dislike, 1 = Like, 2 = Super Like. |
| Personalized | Is this result from an algorithm that is personalized, or just from a random listing? 0 = random, 1 = personalized. |
| Spotify Popularity | Measured on a scale of 0-100, this metric measures how popular the artist is on Spotify. The scale is 0-100 = lesser-known to well-known artists. A higher value represents the song has a larger, more engaged audience. |
Key Takeaways:
- The Piki Music Dataset provides granular information about user engagement with music.
- It incorporates both explicit (likes, dislikes) and implicit (time spent) feedback signals.
- The inclusion of Spotify popularity allows for analysis of recommendation biases and fairness.





Most people like





































Report
Please select a reason for reporting
- 13 Reasons to Switch from Snapchat to Text Messaging
- 7 Powerful Speech to Text Apps to Boost Productivity
- 10 Best Speech to Text Tools for Effortless Transcription
- 13 Free Tools to Easily Transcribe Audio to Text
- 15 Surprising Ways Google's Speech-to-Text Boosts Productivity
- 7 Best Free Online Audio to Text Transcription Tools
- 9 Tips to Transcribe Speech to Text Faster and Better
- 13 Best Speech to Text Software for Windows 10 in 2023
- 7 Tips for Choosing the Best Transcriber for Audio to Text
- 11 Reasons Why Dragon Speech-to-Text Apps are Game-Changers
- 6 Secrets to Enhance Your Speech to Text Transcription
- 6 Brilliant Ways to Boost Productivity with Talk-to-Text on Your MacBook
- 6 Ways Transcription Software Converts Audio to Text
- 8 Tips to Transcribe Speech to Text Like a Pro
- 6 Reasons IBM Watson Speech to Text is a Game-Changer
- 14 Powerful Ways Talk-to-Text Improves Your Workflow
- 12 Top Windows Speech-to-Text Software for Efficient Transcription
- 12 Game-Changing Benefits of Apple's Speech to Text Technology
- 9 Powerful Use Cases for AWS Speech to Text Technology
- 10 Easy Steps to Transcribe YouTube Videos to Text
- transcription audio en texte
- online audio transcription
- free audio file transcription
- free ai audio transcription
- audio transcription service
- audio transcription online free
- audio transcription free online
- audio to transcription software
- audio and transcript
- ai audio transcription free
- voice recording to text converter
- translate voice recording to text
- record voice to text
- audio recording to text converter
- voice recording and transcription
- chatgpt voice to text
- gmail voice to text
- speech to text reader
- speech to text ai free
- speech to talk
- Meshy AI: How to Create 3D Models from Text and Images
- How SEO and Marketing Dashboards Empower Agencies to Drive Results
- How to Use AI Tools to Find Internal Linking Opportunities Across a Business Website
- Discover Your Perfect Haircut with AI Hairstyle Apps
- Free Reputation Calculator Tools: How They're Adapting to Score AI Visibility, Not Just Rankings
- Design Professional Flyers for Free on Your Phone
- Best Free Flyer Maker Apps for Android: Design Like a Pro
- How to Know If Your Business Is Ready for an AI Customer Service Agent
- Revolutionizing Storytelling: From Novels to Screenplays with AI
- Create Engaging Animated Explainer Videos with a Free AI Tool
- Meshy AI: How to Create 3D Models from Text and Images
- ASOMobile Helps Teams Benchmark App Store Screenshots Against Competitors
- How to Match LMS Software With Your Organization's Training Plan
- Revolutionizing Email Marketing Agency with AI
- How to Convert BTC to HNT
- Unleashing the Power of AI: Cognizant's Roadmap for Transformation
- Frame to Video Review: A Practical Look at Turning Two Still Frames Into Motion
- NVIDIA NIM: Revolutionizing Supply Chain Data Analysis with AI
- Top AI Tools That Help Brands Stand Out Offline (Not Just Online)
- Top 5 Cold Email Software: Maximize Your Outreach in 2025

Copyright ©2026 toolify