































Table of Contents
- Key Points
- Building Your 3D City Modeling Toolkit
- Advanced Techniques: LiDAR Integration and Spatial Analysis
- Step-by-Step Guide: Creating a 3D City Model with Python
- OpenStreetMap 3D Modeling: Weighing the Pros and Cons
- Frequently Asked Questions (FAQ)
- Dive Deeper: Related Questions


Building Your 3D City Modeling Toolkit
Setting up Your Python Environment with Anaconda
The foundation of our 3D city modeling adventure is Python, along with the Anaconda distribution. Anaconda streamlines package management and virtual environment creation, essential for keeping your project organized and preventing dependency conflicts.
This setup ensures a smooth workflow, allowing you to focus on the creative aspects of model building. Python, the versatile programming language, brings all the feature to create the whole project.
Installing Necessary Libraries: Before diving into the code, we need to install two key libraries: OSMnx and PyVista. OSMnx simplifies the process of downloading and manipulating data from OpenStreetMap, while PyVista provides the tools for 3D visualization. To install these packages, you'll typically use pip, the Python package installer, within your Anaconda environment.
conda activate your_environment_name
pip install osmnx
pip install pyvista
Replace your_environment_name with the name of the Anaconda environment you've created for this project.
CloudCompare: The presenter touches briefly on using CloudCompare, a powerful open-source 3D point cloud processing software. While not strictly required for the basic Tutorial, CloudCompare can be invaluable for advanced tasks like aligning and merging your OSM-derived models with LiDAR data. This software offers a plethora of tools for manipulating point clouds, performing geometric analysis, and much more.
The Workflow: From OSM Data to 3D Visualization
The process of creating a 3D city model from OSM data involves a series of well-defined steps.
Let's break down the key stages:
- Environment Setup: As discussed above, this is the crucial first step, ensuring you have Python, Anaconda, and the necessary libraries installed.
- Extracting OSM Data: OSMnx enables us to query and download data from OpenStreetMap for a specified location and radius. This data includes information about buildings, streets, and other geographical features.
- Generating Building Footprints: The downloaded data is then processed to generate 2D polygons representing the footprints of buildings. These footprints form the basis for our 3D models.
- Generating 3D Buildings: Building on the 2D footprints, we extrude them vertically to create 3D building models. This extrusion process often involves assigning random heights to the buildings, although more sophisticated techniques using LiDAR data can be employed.
- 3D Visualization: PyVista comes into play at this stage, allowing us to visualize the 3D city model. PyVista provides interactive tools for exploring the model from different angles and perspectives.
- Export Building Function: Creating function about export 3D building file, e.g. obj, gltf.
- Reusing the cloudgify Principle: It can save the city models and reuse the saved file.
- Single Location Experiment: Do some experiments with single location, get models and change radius.
- Script Automation: It can realize function of automatically working.
- Going beyond: To go the height from other dataset, and integrate in a 3D World.
Advanced Techniques: LiDAR Integration and Spatial Analysis
Leveraging LiDAR Data for Enhanced Realism
The tutorial also hints at the possibility of integrating LiDAR (Light Detection and Ranging) data into the modeling process.
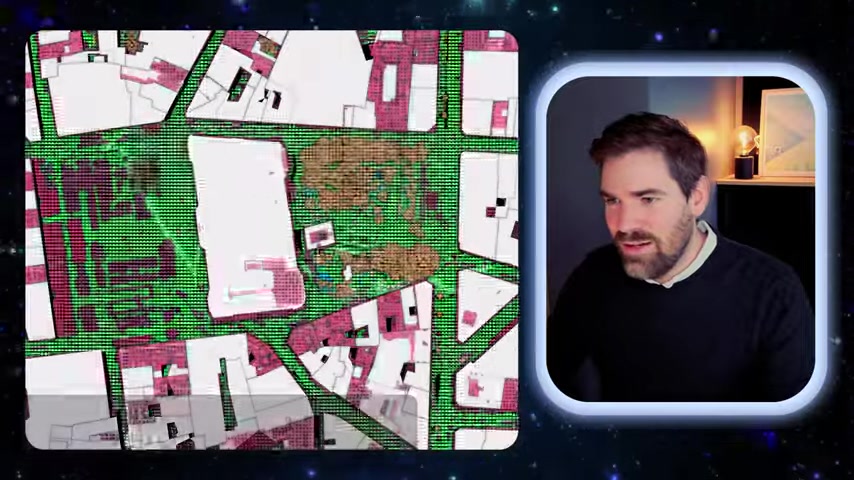
LiDAR data provides highly accurate elevation information, enabling the creation of more realistic building models with varying roof heights and detailed terrain. Integrating LiDAR can significantly improve the visual fidelity of your 3D city models. Here are the benefits to use LiDAR :
- It will make model close to the later data.
- Can leverage data to get height.
- Model the roof differently.
CloudCompare for LiDAR Integration: The presenter also mentions CloudCompare, a powerful tool for manipulating LiDAR data, to compare any output outside of python, like OBJ/GLTF. CloudCompare is valuable for tasks such as aligning and merging LiDAR data with OSM-derived models.
Spatial Analysis with 3D City Models
Once you have a 3D city model, the possibilities for spatial analysis are vast.
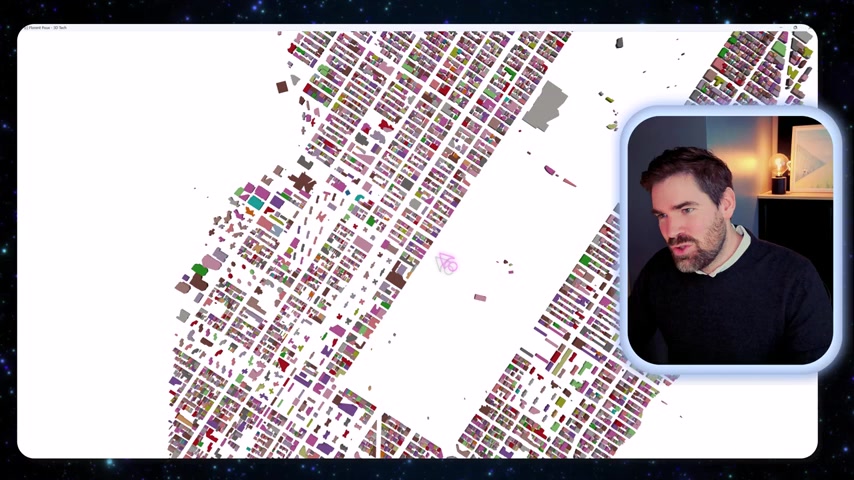
You can analyze building heights, street widths, and population density, gaining valuable insights into urban planning and development. 3D city models can be used for a wide range of applications, including:
- Urban planning and design
- Disaster management and risk assessment
- Real estate development
- Environmental modeling








Most people like


































Report
Please select a reason for reporting
- 13 Reasons to Switch from Snapchat to Text Messaging
- 7 Powerful Speech to Text Apps to Boost Productivity
- 10 Best Speech to Text Tools for Effortless Transcription
- 13 Free Tools to Easily Transcribe Audio to Text
- 15 Surprising Ways Google's Speech-to-Text Boosts Productivity
- 7 Best Free Online Audio to Text Transcription Tools
- 9 Tips to Transcribe Speech to Text Faster and Better
- 13 Best Speech to Text Software for Windows 10 in 2023
- 7 Tips for Choosing the Best Transcriber for Audio to Text
- 11 Reasons Why Dragon Speech-to-Text Apps are Game-Changers
- 6 Secrets to Enhance Your Speech to Text Transcription
- 6 Brilliant Ways to Boost Productivity with Talk-to-Text on Your MacBook
- 6 Ways Transcription Software Converts Audio to Text
- 8 Tips to Transcribe Speech to Text Like a Pro
- 6 Reasons IBM Watson Speech to Text is a Game-Changer
- 14 Powerful Ways Talk-to-Text Improves Your Workflow
- 12 Top Windows Speech-to-Text Software for Efficient Transcription
- 12 Game-Changing Benefits of Apple's Speech to Text Technology
- 9 Powerful Use Cases for AWS Speech to Text Technology
- 10 Easy Steps to Transcribe YouTube Videos to Text
- transcription audio en texte
- online audio transcription
- free audio file transcription
- free ai audio transcription
- audio transcription service
- audio transcription online free
- audio transcription free online
- audio to transcription software
- audio and transcript
- ai audio transcription free
- voice recording to text converter
- translate voice recording to text
- record voice to text
- audio recording to text converter
- voice recording and transcription
- chatgpt voice to text
- gmail voice to text
- speech to text reader
- speech to text ai free
- speech to talk
- How SEO and Marketing Dashboards Empower Agencies to Drive Results
- How to Use AI Tools to Find Internal Linking Opportunities Across a Business Website
- Discover Your Perfect Haircut with AI Hairstyle Apps
- Free Reputation Calculator Tools: How They're Adapting to Score AI Visibility, Not Just Rankings
- Design Professional Flyers for Free on Your Phone
- Best Free Flyer Maker Apps for Android: Design Like a Pro
- How to Know If Your Business Is Ready for an AI Customer Service Agent
- Revolutionizing Storytelling: From Novels to Screenplays with AI
- Create Engaging Animated Explainer Videos with a Free AI Tool
- Stop Multi-Subscribing: Benchmark Top AI Visual Models in One Canvas
- 5 Data Problems That Stall AI Projects in Financial Compliance
- Master Storyboard Drawing: Expert Tips for Non-artists
- The Future of Smart Glasses: Explained & Assembling Guide
- DeepL Translator: The AI-Powered Translation Tool
- AI Video Upscaling: Top Tools Compared for Enhanced Quality
- Bridging the Gap: How One Indie Developer Solved the "Art Asset Nightmare" Using AI Style Transfer
- How I Direct Consistent AI Clips: A Hands-On Guide to Multi-Model Generation
- My Honest Review of VideoAI: The Ultimate Character Voice Generator I've Been Using Lately
- Why do so many AI tools underdeliver for online stores?
- My Brand New Logo: AI-Powered Logo Design for Startups

Copyright ©2026 toolify