































Table of Contents
- Key Points
- Understanding Website Speed and Analysis
- Deep Dive into Key Performance Metrics
- Performing a Website Speed Test: A Step-by-Step Guide
- Dareboost - Pros and Cons
- FAQ
- Related Questions


Understanding Website Speed and Analysis
Why Website Speed Matters
Website speed is a critical factor influencing user experience, Search Engine rankings, and overall website success. A fast-loading website keeps visitors engaged, reduces bounce rates, and improves conversion rates. Slow loading times, on the other hand, can lead to user frustration, abandonment, and a negative brand perception.
From an SEO perspective, search engines like Google consider website speed as a ranking signal. Faster websites are favored in search results, leading to increased organic traffic and visibility. Optimizing your website's speed is therefore essential for attracting and retaining visitors, as well as improving your search engine performance.
Core Web Vitals, a set of specific metrics that Google considers important in a webpage's overall user experience, all depend on your website speed and proper loading times:
- Largest Contentful Paint (LCP): Measures loading performance.
- First Input Delay (FID): Measures Interactivity.
- Cumulative Layout Shift (CLS): Measures Visual Stability.
Keeping these in check ensures your website is user-friendly, and will keep users happy.
Introducing Webpage Analyzers
Webpage analyzers are tools designed to thoroughly examine a website's performance, providing insightful data and recommendations for optimization. These tools analyze various aspects of a website, including loading speed, page size, request counts, and code quality. By identifying bottlenecks and areas for improvement, webpage analyzers empower website owners and developers to enhance their site's performance and deliver a better user experience.
These analyzers often provide a detailed report card for your website, outlining:
- Areas of success: Showcasing what the website does well.
- Areas of needed improvement: Highlighting the specific issues that slow your website down.
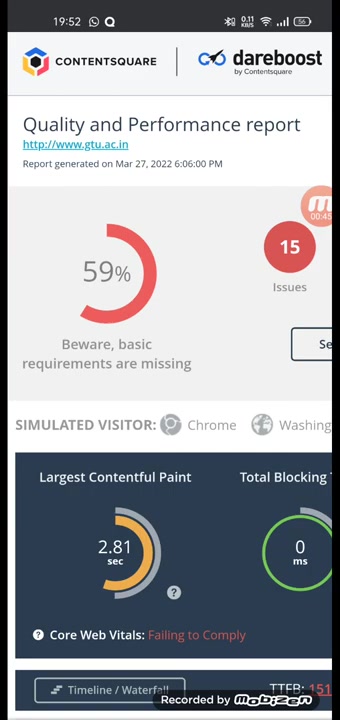
Understanding these reports and acting upon the recommendations is key to enhancing your website's performance.
Deep Dive into Key Performance Metrics
Largest Contentful Paint (LCP): The User's First Impression
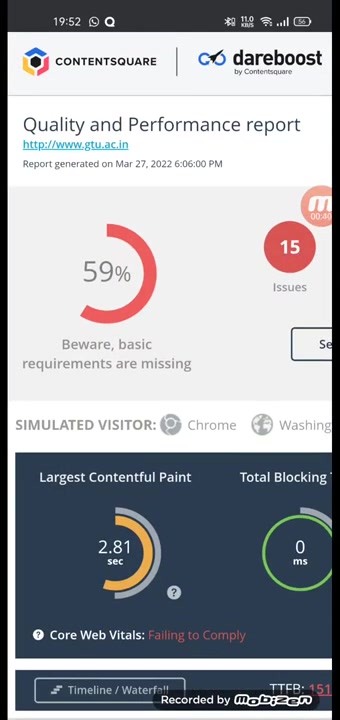
Largest Contentful Paint, or LCP, measures the time it takes for the largest content element (image, video, text block) to become visible on the screen. This metric significantly impacts the user's perception of loading speed. An LCP within 2.5 seconds is considered good, while times exceeding 4 seconds are considered poor and need immediate attention.
Optimize your LCP by:
- Optimizing images: Compressing images without sacrificing quality reduces file sizes and loading times.
- Using a Content Delivery Network (CDN): Distributing your website's content across multiple servers ensures faster delivery to users worldwide.
- Minifying CSS and JavaScript: Removing unnecessary characters from code files reduces their size and improves loading speed.
Total Blocking Time (TBT): Ensuring a Smooth User Experience
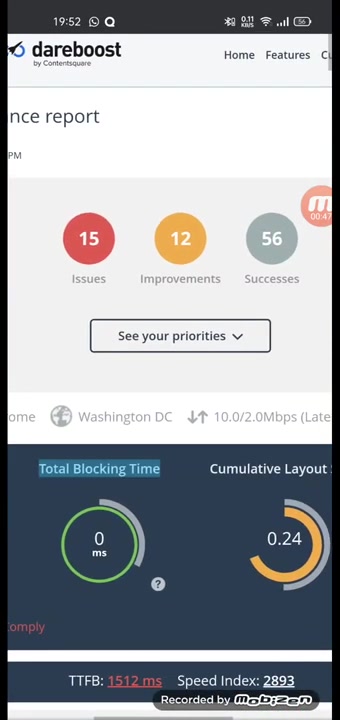
Total Blocking Time, or TBT, measures the total time a page is blocked from responding to user input during the loading process. High TBT can lead to a frustrating user experience, as visitors may encounter delays or unresponsive elements. Aim for a TBT of less than 300 milliseconds for optimal performance.
Reduce your TBT by:
- Minimizing JavaScript execution time: Optimizing JavaScript code and deferring unnecessary scripts improves loading speed.
- Leveraging browser caching: Caching static assets (images, CSS, JavaScript) reduces the need to download them repeatedly, improving loading times for returning visitors.
- Optimizing third-party scripts: Carefully evaluate third-party scripts and remove any unnecessary or poorly performing ones.
Cumulative Layout Shift (CLS): Maintaining Visual Stability
Cumulative Layout Shift, or CLS, measures the unexpected movement of visual elements on a page. High CLS can disrupt the user experience, as visitors may accidentally click the wrong buttons or lose their place while reading. Strive for a CLS score of less than 0.1 for a visually stable experience.
Improve your CLS score by:
- Specifying image and video dimensions: Defining width and height attributes for images and videos prevents layout shifts during loading.
- Reserving space for ads: Allocating space for ads ensures they don't push content around unexpectedly.
- Avoiding inserting content above existing content: Inserting new content above existing content can cause layout shifts and disrupt the user experience.
Performing a Website Speed Test: A Step-by-Step Guide
Selecting a Webpage Analyzer
There are many webpage analyzers available, each with its own strengths and weaknesses. Some popular options include:
- Dareboost: Offers detailed performance reports, including recommendations for improvement.
- Google PageSpeed Insights: Provides insights into both mobile and desktop performance, along with actionable suggestions.
- GTmetrix: A comprehensive tool for analyzing website speed and performance, with detailed reports and historical data.
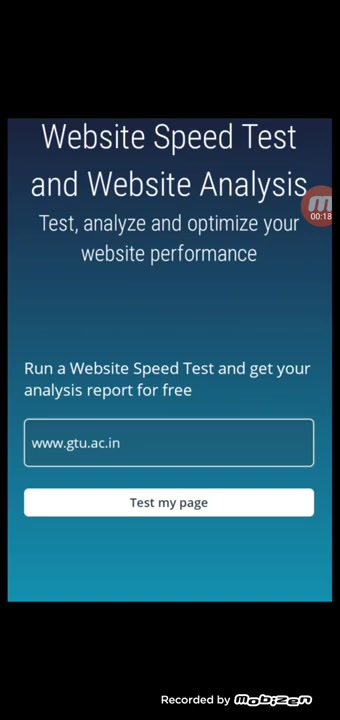
Choose an analyzer that meets your specific needs and provides the data you need to optimize your website. Dareboost, as mentioned, provides reports that include performance data, potential issues, and successes.
Inputting Your Website URL
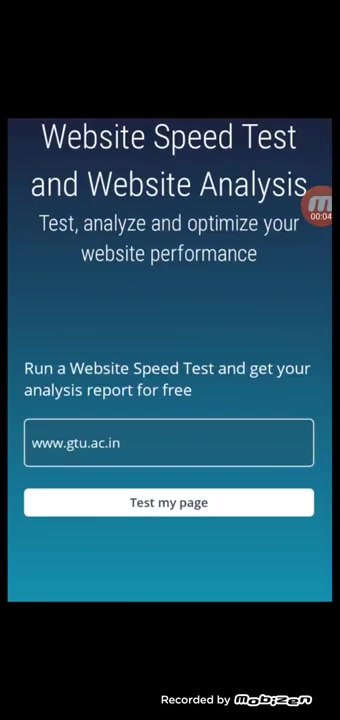
Once you've selected a webpage analyzer, simply input your website's URL into the designated field. Most tools will then initiate a scan of your website, analyzing its performance and generating a report.
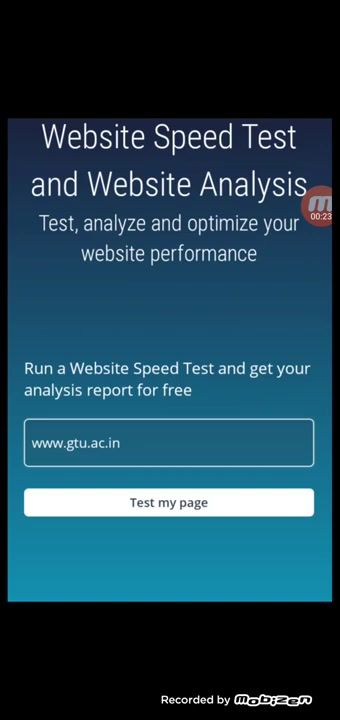
Make sure to include the 'www' prefix if it is relevant to your website's address. This ensures the analyzer correctly assesses the specific version of your site.
Analyzing the Results
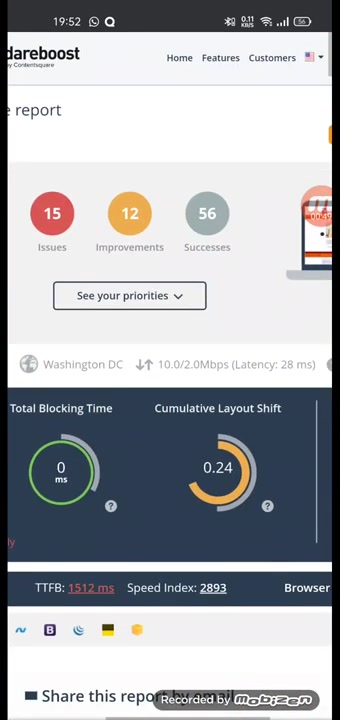
After the scan is complete, the webpage analyzer will present a detailed report. Take the time to carefully review the results, paying attention to the key performance metrics (LCP, TBT, CLS) and the recommendations for improvement. Identify the areas where your website is performing well and the areas where it needs attention.
Pay close attention to the 'Things to Improve' sections. These give actionable steps that you or your development team can take to speed up your website.
Here is an example of what a typical website performance report may look like:







Most people like






























Report
Please select a reason for reporting
- 13 Reasons to Switch from Snapchat to Text Messaging
- 7 Powerful Speech to Text Apps to Boost Productivity
- 10 Best Speech to Text Tools for Effortless Transcription
- 13 Free Tools to Easily Transcribe Audio to Text
- 15 Surprising Ways Google's Speech-to-Text Boosts Productivity
- 7 Best Free Online Audio to Text Transcription Tools
- 9 Tips to Transcribe Speech to Text Faster and Better
- 13 Best Speech to Text Software for Windows 10 in 2023
- 7 Tips for Choosing the Best Transcriber for Audio to Text
- 11 Reasons Why Dragon Speech-to-Text Apps are Game-Changers
- 6 Secrets to Enhance Your Speech to Text Transcription
- 6 Brilliant Ways to Boost Productivity with Talk-to-Text on Your MacBook
- 6 Ways Transcription Software Converts Audio to Text
- 8 Tips to Transcribe Speech to Text Like a Pro
- 6 Reasons IBM Watson Speech to Text is a Game-Changer
- 14 Powerful Ways Talk-to-Text Improves Your Workflow
- 12 Top Windows Speech-to-Text Software for Efficient Transcription
- 12 Game-Changing Benefits of Apple's Speech to Text Technology
- 9 Powerful Use Cases for AWS Speech to Text Technology
- 10 Easy Steps to Transcribe YouTube Videos to Text
- transcription audio en texte
- online audio transcription
- free audio file transcription
- free ai audio transcription
- audio transcription service
- audio transcription online free
- audio transcription free online
- audio to transcription software
- audio and transcript
- ai audio transcription free
- voice recording to text converter
- translate voice recording to text
- record voice to text
- audio recording to text converter
- voice recording and transcription
- chatgpt voice to text
- gmail voice to text
- speech to text reader
- speech to text ai free
- speech to talk
- Revolutionizing Storytelling: From Novels to Screenplays with AI
- Create Engaging Animated Explainer Videos with a Free AI Tool
- Stop Multi-Subscribing: Benchmark Top AI Visual Models in One Canvas
- Best Seedance 2.5 API Provider: Every Price on the Market, Checked at Source
- AI OnlyFans: How to Generate $30,000/Month (Legally)
- Transform Your Script into an Engaging Video with AI Video Maker!
- AI Marketing Automation: A Comprehensive Guide for Small Businesses
- Midjourney Alternative for Anime Art Creators: Why PixAI May Be Better for Character Workflows
- 10 Things Most People Get Wrong About AI Image Search
- AI Girlfriend Apps: Top Choices Redefining Relationships 2025
- Python Random Name Generator Tutorial
- Generate Unique Names with Python Random Name Generator
- Code a JavaScript Name Generator
- Create a Fun Name Generator App - Easy JavaScript Project!
- Experience Roblox's Avatar Creation for Karl Jacobs!
- May TBR Game: How a Letter Generator Chooses My Reads
- AI Celebrity Chat: Hilarious Pick-Up Lines & Chatbot Chaos!
- Embrace Chaos with the Random Makeup Challenge
- Boost Audience Engagement with the Wheel of Names
- Engage Your Audience with the Wheel of Names!

Copyright ©2026 toolify