


Chartify



What is Chartify?
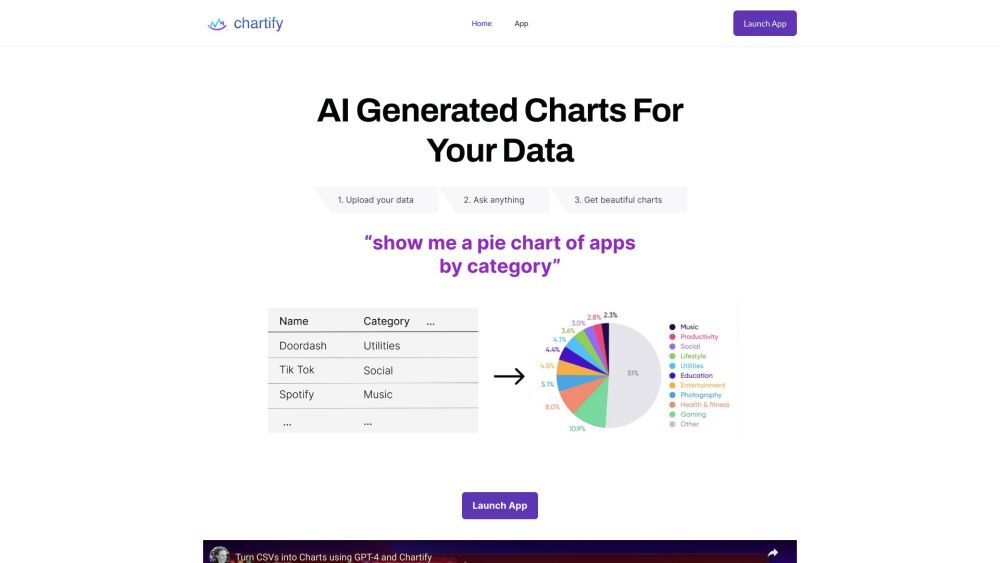
Chartify generates charts and graphs from CSV files and databases using OpenAI's GPT3 model. You can ask questions about your data using natural language and get charts, and the underlying code for plotly, matplotlib, and seaborn. Turn CSVs and database tables into rich, interactive charts and graphs. Let our AI suggest new ways to visualize data, or ask for your own, from pie charts to line graphs and bar charts.
How to use Chartify?
1. Upload your data (CSV, Postgres, or MySQL). 2. Get AI-recommended visualizations. 3. Ask questions to generate charts across Plotly, Matplotlib, Seaborn, and Charts.js.
Chartify's Core Features
AI-powered chart generation
Natural language data querying
Support for multiple chart libraries (Plotly, Matplotlib, Seaborn, Charts.js)
CSV and database connectivity
Chartify's Use Cases
Generating visualizations from CSV data using natural language queries.
Creating interactive charts from database tables without manual coding.
FAQ from Chartify
What data sources does Chartify support?
What chart libraries are supported by Chartify?
How does Chartify generate charts?
Chartify Reviews (0)
Analytic of Chartify
Chartify Website Traffic Analysis
Chartify Launch embeds
Use website badges to drive support from your community for your Toolify Launch. They're easy to embed on your homepage or footer.



Alternative of Chartify

More Content About Chartify
10 Effective Charting Techniques to Visualize Your Data
By Eloise on May 17 2024
Master Data Visualization: 10 Game-Changing Charting Techniques!
Social Listening