



ECharts Data Visualization - Chrome Extension
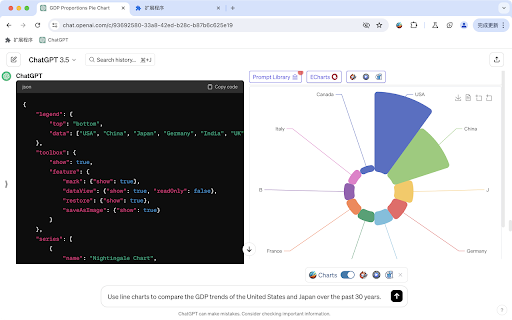


What is ECharts Data Visualization ai chrome extension?
ECharts is a powerful, free charting and visualization library that offers a wide array of chart types, including line, bar, pie, scatter, map, and more. It's designed to be highly customizable and interactive, making it suitable for creating dynamic and engaging data visualizations for web applications, dashboards, and reports. ECharts supports both declarative configuration and imperative programming, allowing developers to tailor the charts to their specific needs. It also provides features like data zooming, tooltips, and visual encoding to enhance data exploration and understanding.
How to use ECharts Data Visualization ai chrome extension?
To use ECharts, include the library in your HTML file, define a container element for the chart, and then configure the chart options using JavaScript. The options object specifies the chart type, data, axes, and other visual properties. ECharts provides extensive documentation and examples to guide users through the process of creating various chart types.
ECharts Data Visualization ai chrome extension's Core Features
Wide range of chart types (line, bar, pie, scatter, etc.)
Highly customizable and interactive
Declarative configuration and imperative programming support
Data zooming and tooltips
Visual encoding for enhanced data exploration
ECharts Data Visualization ai chrome extension's Use Cases
Creating interactive dashboards for business intelligence
Visualizing scientific data in web applications
Generating reports with dynamic charts
Embedding charts in websites and blogs
FAQ from ECharts Data Visualization
Is ECharts free to use?
What types of charts does ECharts support?
Does ECharts require JavaScript knowledge?
Analytic of ECharts Data Visualization AI Chrome Extension
ECharts Data Visualization Active Users
Total Installed User
Alternative of ECharts Data Visualization AI Chrome Extension
 72.02%