


Dot
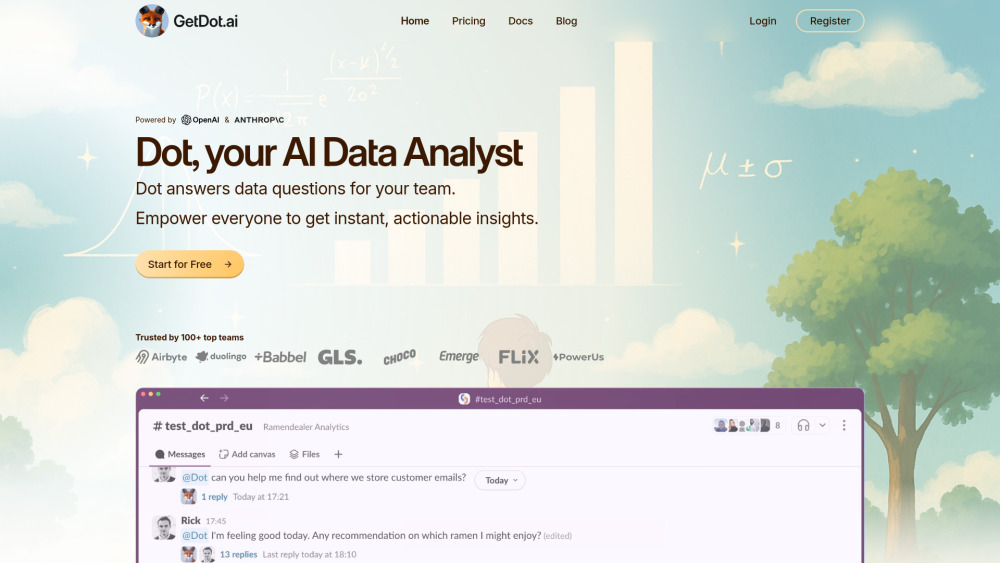


What is Dot?
Dot is an AI data analyst that lives where you work—directly in Slack or Microsoft Teams. By connecting seamlessly to your existing data warehouses (Snowflake, BigQuery, Redshift) and BI tools, Dot enables everyone on your team to analyze data through natural language queries. Ask questions about your business metrics, visualize trends, or generate comprehensive reports—all without writing a single line of SQL or Python code. Unlike general AI tools, Dot is specifically engineered for data analysis, eliminating hallucinations and ensuring reliable, accurate insights every time.
How to use Dot?
Upload your data (CSV, XLSX) or connect your database (BigQuery, Redshift, Postgres, Clickhouse, Snowflake, Databricks, ...) , ask questions about the data, and Dot will analyze the data and provide results in charts, tables, or reports.
Dot's Core Features
AI Data Analysis
Charts & Graphs Generation
Data Transformation
Insights Generation
Data Science (Modeling and Predictive Forecasting)
Report Generation
Dot's Use Cases
Product Analytics
Customer & Marketing Analytics
Sales Intelligence & Forecasting
Customer Support Analytics
Self-service Analytics
Financial Analysis, Budgeting & Risk Management
Supply Chain & Inventory Optimization
Fraud Detection & Compliance Reporting
Human Resources Analytics & Workforce Planning
FAQ from Dot
What can Dot do?
Where is Dot available?
Which databases does Dot support?
How quickly can I get results?
How does Dot compare to using ChatGPT for data analysis?
Can Dot perform complex data analysis beyond basic queries?
How does Dot prevent AI hallucinations in data analysis?
What is the implementation time for Dot AI data analyst?
Dot Support Email & Customer service contact & Refund contact etc.
Here is the Dot support email for customer service: [email protected] . More Contact, visit the contact us page(https://www.getdot.ai/about)
Dot Company
Dot Company name: Dot, your AI Data Analyst .
Dot Company address: .
More about Dot, Please visit the about us page(https://www.getdot.ai/about).
Dot Login
Dot Login Link: https://app.getdot.ai/login
Dot Sign up
Dot Sign up Link: https://app.getdot.ai/register
Dot Linkedin
Dot Linkedin Link: https://www.linkedin.com/company/getdot-ai
Dot Twitter
Dot Twitter Link: https://twitter.com/GetDotAi
Dot Reviews (0)
Analytic of Dot
Dot Website Traffic Analysis
Geography
Top 5 Regions


Dot Launch embeds
Use website badges to drive support from your community for your Toolify Launch. They're easy to embed on your homepage or footer.





Social Listening