































Table of Contents
- Key Points
- Understanding ChartAssistant
- Utilizing ChartAssistant
- ChartAssistant Pricing
- The Benefits & Drawbacks of ChartAssistant
- Core Features of ChartAssistant
- Use Cases for ChartAssistant
- Frequently Asked Questions about ChartAssistant
- Related Questions


Understanding ChartAssistant
What is ChartAssistant?
ChartAssistant is an innovative model designed to revolutionize data visualization. It is crafted to generate natural language descriptions of charts, transforming complex visual data into easily understandable narratives. Unlike traditional methods that rely on manual interpretation, ChartAssistant automates the process, making Data Insights accessible to a broader audience. The primary goal is to enable users to quickly grasp key trends, Patterns, and insights from charts without requiring extensive technical expertise.
ChartAssistant's capability to articulate data in natural language significantly enhances data literacy across different sectors. By converting charts into descriptive text, it ensures that stakeholders, regardless of their background, can make well-informed decisions. This technology is particularly beneficial in fields such as business analytics, academic research, and financial reporting, where clear and concise communication of data is crucial.
The effectiveness of ChartAssistant lies in its advanced AI algorithms, which are capable of understanding and interpreting various Chart types. From simple bar graphs to complex scatter plots, the model can extract and summarize the core messages conveyed by the data. This level of sophistication makes ChartAssistant a valuable tool for anyone looking to harness the power of data visualization.
ChartAssistant addresses several key challenges:
- Accessibility: Makes complex data understandable for non-technical users.
- Efficiency: Automates the interpretation process, saving time and resources.
- Accuracy: Provides reliable summaries and responses based on chart data.
- Insight Generation: Helps users uncover Hidden trends and patterns within their data.
By providing natural language descriptions and responding to queries about charts, ChartAssistant enhances data-driven decision-making and improves overall data literacy.
The Revolutionary Leap in Data Visualization
ChartAssistant represents a revolutionary leap in data visualization.
By transforming charts into natural language descriptions, ChartAssistant makes data accessible to everyone, regardless of their technical background. This innovation is particularly crucial in today's data-driven world, where informed decision-making relies on the ability to quickly and accurately interpret complex information.
The benefits of this revolutionary approach include:
- Enhanced Clarity: Complex charts are Simplified into clear, concise descriptions, making it easier to understand the core message.
- Increased Accessibility: Non-technical users can easily grasp the insights from data visualizations without specialized training.
- Improved Efficiency: Automated interpretation saves time and resources, allowing for faster analysis and decision-making.
- Broader Application: The technology can be applied across various industries, from business analytics to academic research, enhancing data literacy and understanding.
ChartAssistant's impact extends beyond mere simplification. It fosters a deeper engagement with data, encouraging users to ask questions and explore insights that might otherwise be overlooked. This interactive approach transforms data visualization from a passive observation to an active exploration, empowering users to make more informed and strategic decisions.
Furthermore, ChartAssistant's ability to respond to natural language queries about charts adds an extra layer of functionality. Users can ask specific questions about the data and receive Instant, Relevant answers, creating a dynamic and intuitive data exploration experience.
In summary, ChartAssistant represents a significant advancement in data visualization, making complex information more accessible, understandable, and actionable for a wide range of users.
Main Functions of ChartAssistant
ChartAssistant excels in identifying and articulating the main trends, patterns, and insights highlighted in data visualizations.

It pinpoints key data points and comparisons, providing users with a clear understanding of the information presented in the charts. This capability ensures that users can quickly grasp the essential elements of the data without getting bogged down in technical details.
Here's a detailed look at its main functions:
- Trend Identification: ChartAssistant analyzes charts to identify upward, downward, or stable trends, providing insights into how data changes over time.
- Pattern Recognition: The model recognizes recurring patterns within the data, such as seasonal variations or cyclical fluctuations, which can be crucial for forecasting and strategic planning.
- Insight Extraction: ChartAssistant extracts valuable insights by identifying correlations, anomalies, and significant data points that might not be immediately obvious.
- Key Data Point Highlighting: The model highlights critical data points, such as maximums, minimums, and inflection points, drawing attention to important values within the chart.
- Comparison Facilitation: ChartAssistant makes it easy to compare different segments of data, providing context and enabling users to assess relative performance and identify disparities.
By focusing on these main functions, ChartAssistant ensures that users can efficiently extract the most relevant information from data visualizations, leading to more informed decision-making and a deeper understanding of underlying trends and patterns. Whether analyzing market trends, tracking business performance, or conducting scientific research, ChartAssistant provides the tools needed to unlock the full potential of data.
ChartAssistant Responds to Queries
ChartAssistant is designed not only to describe charts but also to respond to natural language queries.
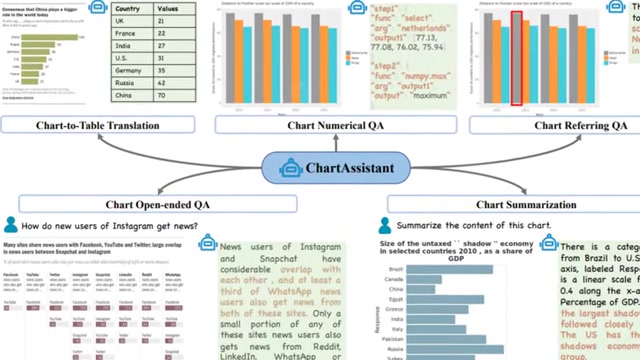
This interactive capability allows users to delve deeper into the data, extracting valuable information and metadata with ease. By understanding and processing questions phrased in everyday language, ChartAssistant breaks down the barriers to data exploration, making it accessible to a wider audience.
Key features of ChartAssistant's query response system include:
- Natural Language Processing (NLP): ChartAssistant uses advanced NLP techniques to understand the intent behind user queries, even when they are phrased informally.
- Data and Metadata Extraction: The model can extract specific data points, statistical measures, and other relevant metadata from the chart in response to user questions.
- Contextual Understanding: ChartAssistant maintains context during a conversation, allowing users to ask follow-up questions and explore related aspects of the data.
- Customized Responses: The model generates responses that are tailored to the specific query, providing relevant and actionable information.
This ability to respond to natural language queries transforms data visualization from a static representation into a dynamic conversation. Users can ask questions such as:
- "What was the highest sales month?"
- "What is the average customer satisfaction rating?"
- "How does this year's revenue compare to last year's?"
ChartAssistant processes these queries and delivers instant, accurate answers, enhancing the overall data exploration experience. This feature is particularly valuable for business analysts, researchers, and decision-makers who need to quickly access and interpret data insights.
Utilizing ChartAssistant
How to Leverage ChartAssistant for Data Analysis
To effectively utilize ChartAssistant for data analysis, follow these steps to harness its capabilities fully. First, upload the chart image to the ChartAssistant platform.

ChartAssistant supports various chart types, including bar graphs, pie charts, line graphs, and scatter plots.
Step-by-step instructions:
- Upload the Chart: Begin by uploading the image of the chart you want to analyze. Ensure the image is clear and well-defined for optimal interpretation.
- Generate Natural Language Description: Once the chart is uploaded, ChartAssistant automatically generates a natural language description summarizing the chart's key trends and patterns.
- Ask Questions: Use the natural language query feature to ask specific questions about the chart. For example, "What was the highest sales month?" or "What is the trend in customer satisfaction over the past year?"
- Analyze the Responses: ChartAssistant provides instant, accurate answers based on the chart data. Use these responses to inform your analysis and gain deeper insights.
- Iterate and Explore: Continue asking questions and exploring different aspects of the data to uncover hidden trends and correlations.
By following these steps, you can leverage ChartAssistant to transform complex data visualizations into actionable insights. Whether you are analyzing market trends, tracking business performance, or conducting scientific research, ChartAssistant provides the tools needed to unlock the full potential of your data.
Core Features of ChartAssistant
Key Capabilities and Benefits
ChartAssistant comes packed with a range of core features that make it an indispensable tool for data visualization and analysis. These features are designed to enhance accessibility, improve efficiency, and empower users to make more informed decisions.
Key Features:
-
Natural Language Description: ChartAssistant automatically generates natural language descriptions of charts, making complex data accessible to non-technical users.
-
Natural Language Query Response: The model responds to natural language queries, allowing users to extract specific information and insights from charts through simple questions.
-
Trend and Pattern Identification: ChartAssistant identifies and articulates key trends, patterns, and insights within data visualizations, providing a clear understanding of underlying dynamics.
-
Data and Metadata Extraction: The tool extracts valuable data points and metadata from charts, enabling users to perform deeper analysis and uncover hidden correlations.
-
Domain Gap Bridging: ChartAssistant bridges the gap between charts and general images, outperforming multimodal models like GPT-4V, ensuring accurate and context-aware interpretations.
Benefits:
- Enhanced Data Literacy: By converting charts into descriptive text, ChartAssistant makes data understandable for a broader audience.
- Improved Decision-Making: Users can quickly grasp essential insights from data visualizations, leading to more informed and strategic decisions.
- Increased Efficiency: Automated interpretation saves time and resources, allowing for faster analysis and reporting.
- Broader Application: ChartAssistant can be applied across various industries, from business analytics to academic research, enhancing data literacy and understanding.
By combining these core features and benefits, ChartAssistant transforms data visualization from a passive observation to an active exploration, empowering users to unlock the full potential of their data.








Most people like
































Report
Please select a reason for reporting
- 13 Reasons to Switch from Snapchat to Text Messaging
- 7 Powerful Speech to Text Apps to Boost Productivity
- 10 Best Speech to Text Tools for Effortless Transcription
- 13 Free Tools to Easily Transcribe Audio to Text
- 15 Surprising Ways Google's Speech-to-Text Boosts Productivity
- 7 Best Free Online Audio to Text Transcription Tools
- 9 Tips to Transcribe Speech to Text Faster and Better
- 13 Best Speech to Text Software for Windows 10 in 2023
- 7 Tips for Choosing the Best Transcriber for Audio to Text
- 11 Reasons Why Dragon Speech-to-Text Apps are Game-Changers
- 6 Secrets to Enhance Your Speech to Text Transcription
- 6 Brilliant Ways to Boost Productivity with Talk-to-Text on Your MacBook
- 6 Ways Transcription Software Converts Audio to Text
- 8 Tips to Transcribe Speech to Text Like a Pro
- 6 Reasons IBM Watson Speech to Text is a Game-Changer
- 14 Powerful Ways Talk-to-Text Improves Your Workflow
- 12 Top Windows Speech-to-Text Software for Efficient Transcription
- 12 Game-Changing Benefits of Apple's Speech to Text Technology
- 9 Powerful Use Cases for AWS Speech to Text Technology
- 10 Easy Steps to Transcribe YouTube Videos to Text
- transcription audio en texte
- online audio transcription
- free audio file transcription
- free ai audio transcription
- audio transcription service
- audio transcription online free
- audio transcription free online
- audio to transcription software
- audio and transcript
- ai audio transcription free
- voice recording to text converter
- translate voice recording to text
- record voice to text
- audio recording to text converter
- voice recording and transcription
- chatgpt voice to text
- gmail voice to text
- speech to text reader
- speech to text ai free
- speech to talk
- How to Use AI Tools to Find Internal Linking Opportunities Across a Business Website
- Discover Your Perfect Haircut with AI Hairstyle Apps
- Free Reputation Calculator Tools: How They're Adapting to Score AI Visibility, Not Just Rankings
- Design Professional Flyers for Free on Your Phone
- Best Free Flyer Maker Apps for Android: Design Like a Pro
- How to Know If Your Business Is Ready for an AI Customer Service Agent
- Revolutionizing Storytelling: From Novels to Screenplays with AI
- Create Engaging Animated Explainer Videos with a Free AI Tool
- Stop Multi-Subscribing: Benchmark Top AI Visual Models in One Canvas
- Best Seedance 2.5 API Provider: Every Price on the Market, Checked at Source
- Top AI Social Media Management Tools: Automate Your Content Strategy
- Free AI Text to Video Generator: Create Stunning Videos from Text
- Discover 17 ChatGPT Alternatives: A Comprehensive Comparison
- Character.AI vs. Janitor AI: Which AI Chat Platform Reigns Supreme?
- Top Virtual Assistant Companies in 2026: Reviews, Pricing, and Plans Compared
- Unveiling FaceCheck.ID: Revolutionizing Reverse Image Searches with AI
- 11 Best AI Dialers in 2026: Features, Pricing, Pros and Cons
- How I Direct Consistent AI Clips: A Hands-On Guide to Multi-Model Generation
- A Realistic Review of the Photo Generator Image Tool
- Playwright MCP Server: Automated Web Testing with Agent Mode

Copyright ©2026 toolify