































Table of Contents


Getting Started with Python Data Analysis
Why Python, Google Colab, and Gemini AI?
This Tutorial explores Python, Google Colab, and Gemini AI, which offer several advantages for data analysis. Python's extensive libraries, especially Pandas, are invaluable for data manipulation and analysis. Google Colab provides a cloud-based environment, removing the need for local installations. Google Colab is a virtual server with Python and all necessary libraries pre-installed
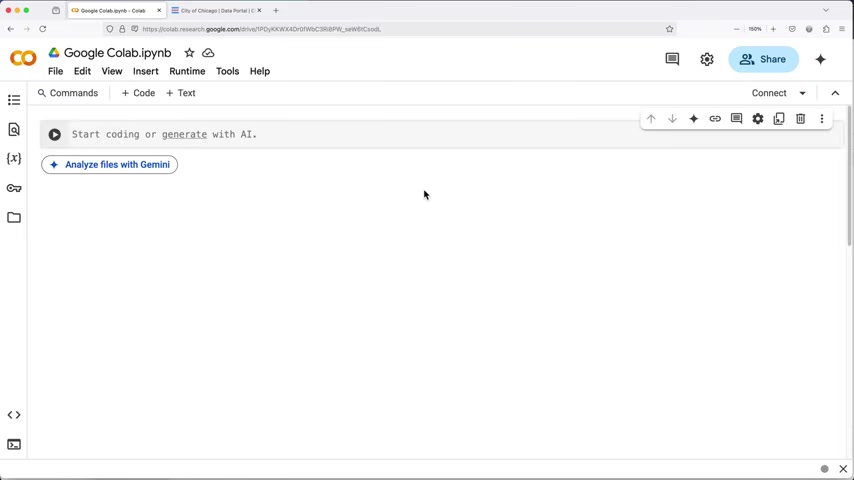
. Gemini AI's code generation features further simplify the process, making it less daunting for beginners.
This combination offers a streamlined and accessible pathway into data analysis, allowing users to focus on insights rather than wrestling with complex coding setups.
Keywords: Python, Data Analysis, Google Colab, Gemini AI, Pandas
Accessing Google Colab and Setting Up
To begin, navigate to colab.research.google.com in your web browser
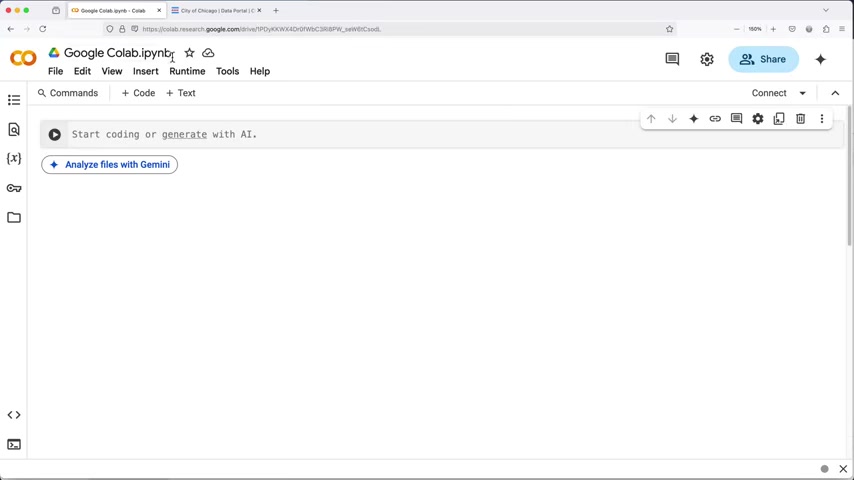
. This opens Google Colab, a free, cloud-based platform. Create a new notebook within Google Colab by clicking 'File' then 'New Notebook.' This creates a blank Python environment where you can start coding. You can find the 'File' option on the top left corner of the screen. No local installations are needed, making it immediately accessible.
This user-friendly environment promotes quick and efficient data exploration.
Keywords: Google Colab, Python environment, data exploration
Data Acquisition: Importing a CSV File
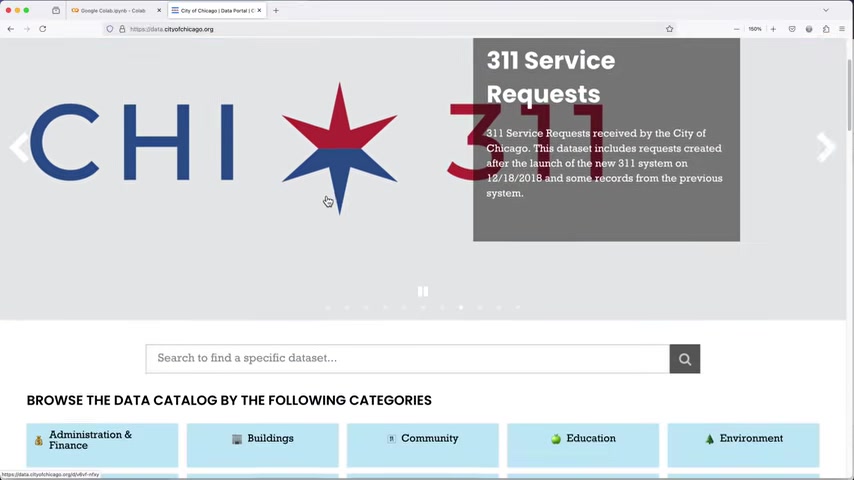
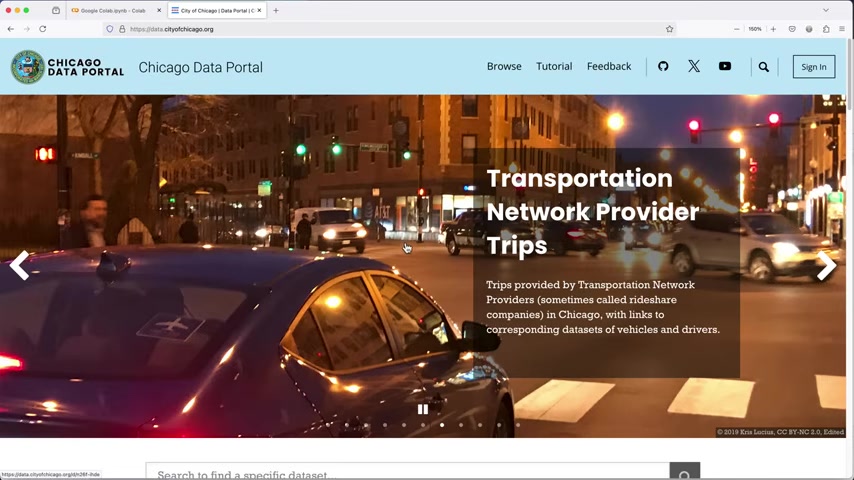
To analyze data, first, some data is required. While data can be sourced from Excel files, Google Sheets, or SQL databases, this tutorial uses a simple CSV file for demonstration purposes. CSV, or Comma Separated Values, is a common format for storing tabular data. A CSV file from the Chicago Data Portal is downloaded.
To acquire a dataset, navigate to data.cityofchicago.org , a public data portal. This Chicago Data Portal contains various datasets.
Keywords: data source, csv file, chicago data portal
Locating and Downloading the Traffic Crashes Dataset
From the Chicago Data Portal homepage, you can browse the data catalog or search for specific datasets
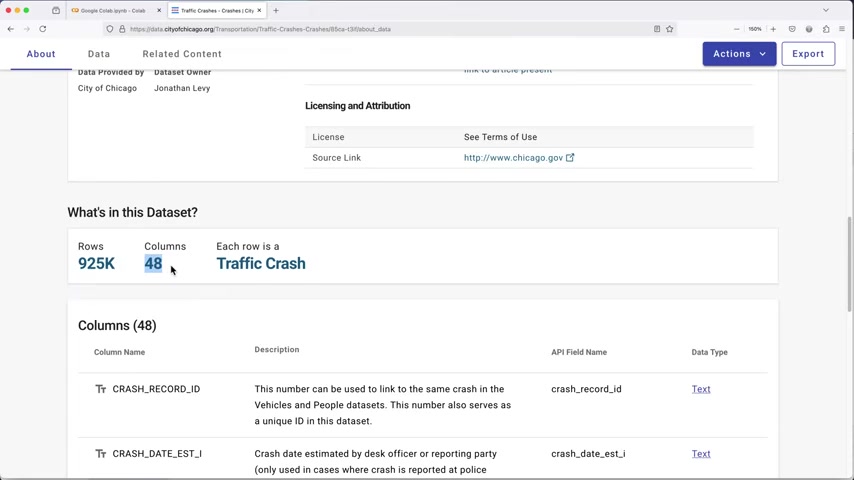
. For this tutorial, the 'Traffic Crashes - Crashes' dataset is selected from the 'Transportation' category. After landing on the description page, you can find a dataset with 925K rows and 48 columns.
This dataset provides information about each traffic crash on city streets within the City of Chicago limits and under the jurisdiction of the Chicago Police Department (CPD). To download the dataset, click on 'Export' in the top right corner and choose 'CSV' as the format. Once the download is initiated, wait for the file to download onto your computer .
Keywords: traffic crashes, transportation data, dataset download
Importing Pandas Library in Python
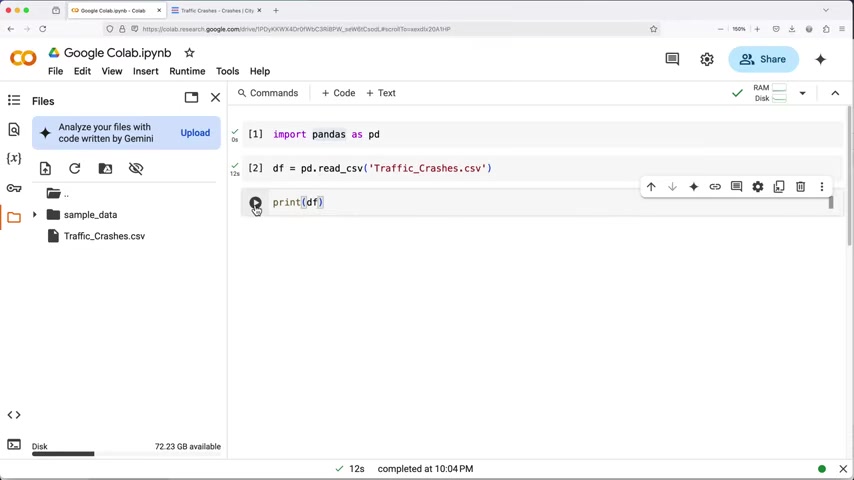
To begin coding on Google Colab. Now switch back to the Google Colab notebook and start adding code. Every python data analysis needs a code called Pandas library. Import the Pandas library by entering the code:
import pandas as pd
The common approach is to rename it to ‘pd,’ making it easier to reference. Click the Play button to run the code and initiate the code block.
Keywords: pandas library, import pandas, data analysis python
Upload the CSV Data to Google Colab
To work with the downloaded CSV data, it needs to be uploaded into the Google Colab environment
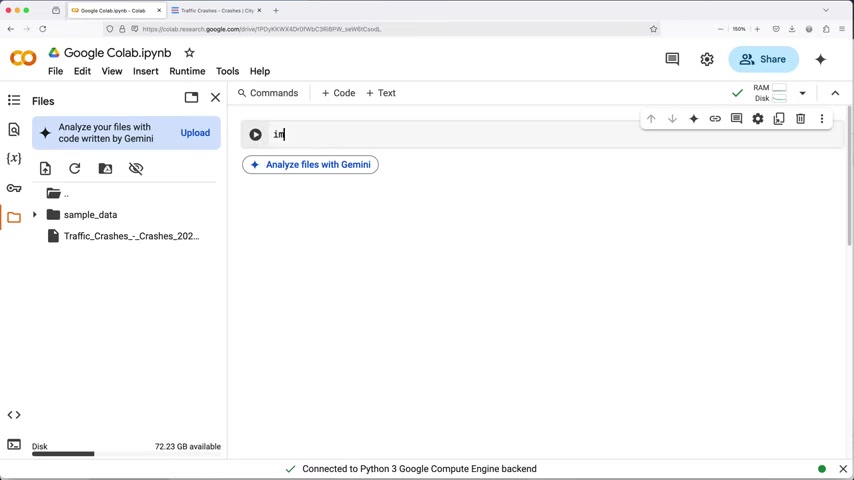
. On the left-hand side of the Google Colab interface, find the Files icon. This section shows the files currently available in the Colab environment. Click the 'Upload' button and choose the downloaded CSV file from your computer.
Bear in mind that these files are for temporary and will be gone after runtime terminates. Once upload is complete, rename the file in Colab file section with a shorter name.
Keywords: Google Colab file upload, uploading csv data, data access
Reading the CSV File into a Pandas Dataframe
Now that the Pandas library has been imported and data uploaded, the next step is to read the data. To load this data to Pandas library, run this code:
df = pd.read_csv('Traffic_Crashes.csv')
pd.read_csv(‘filename’) allows Pandas to easily read data from the CSV file and create what’s called a “Data Frame.” A Data Frame will display the data in an organized table, making it more readable and convenient to use.
In programming, indexes start with ‘0’ rather than ‘1.’ In Google Colab, simply enter df then hit the run button to display your Data Frame.
Keywords: pandas dataframe, csv read, data frame display
Getting Help from Gemini AI
To use Gemini AI to assist data analysis, find the Gemini Icon on the upper right corner of the Google Colab page. Use this box as you would other AI chatbots, such as Google Bard, or ChatGPT, and the chatbot will generate code to help write lines. Be sure to review and verify any code provided by Google Gemini AI.
Keywords: google gemini, data analysis tool, AI code generation
Removing Unnecessary Data Using Drop Columns
To make data analysis easier, you may want to exclude columns . Google Gemini AI can assist if you ask the proper question to the program:
Delete columns Crash Record ID, Crash Date from the Pandas Data Frame df.
To ensure correct function:
- Ensure quotations are the correct style (“” vs. ‘’).
- Ensure the quotation encloses Crash Record ID and Crash Date.
Now, let’s use code with caution. The correct code generated should look like:
df = df.drop(['CRASH_RECORD_ID', 'CRASH_DATE_EST_I'], axis=1)
Running the lines now will not print, but you have deleted those columns of data in the notebook.
Keywords: drop columns, reduce data, pandas analysis
Inspecting an Individual Row of Data
To inspect the Data Set, every data point can be displayed, but due to the wide range of Data Points, an inspection on a single row is best [t: 133]. Run this code to inspect a row:
df.iloc[0]
Remember that we want to avoid ‘Print’ statements. This code then will provide a display of the selected row. Inspecting the Data Frame is helpful in deciding what to include, and exclude.
Keywords: data set columns, individual rows, inspect dataset
Data Summarization: Total Crashes by Year
Data collection can be summarized by category using the Group By coding Prompt [t: 0].
get the number of crashes by year
When prompted, Google Gemini AI will generate this code for Python:
df['CRASH_YEAR'] = df['CRASH_DATE'].dt.year
crashes_by_year = df.groupby('CRASH_YEAR').size()
print(crashes_by_year)
If you prefer not to use the ‘Print()’ display, copy “crash_by_year” or the display variable name to the next code box.
Now there should be an output of record data broken down by ‘Year’.
Keywords: Group by statement, Google Gemini AI, traffic crashes analysis
Data Visualizations: Creating a Bar Chart
To create visualization from Python language:
Create a Chart from crashes_by_year
To do so, you will receive generated Python, however, Google Gemini AI needs another import. Google Gemini AI needs help understanding the new code.
import matplotlib.pyplot as plt
crashes_by_year.plot(kind='bar', figsize=(10, 6))
plt.title('Number of Crashes by Year')
plt.xlabel('Year')
plt.ylabel('Number of Crashes')
plt.show()
Now, here’s how the prompt should be setup:
change the color of the bars to green
When ready, copy the new code into the second code box and display new code. Be sure to separate import and the graphing into separate boxes.
Keywords: chart creation, create chart code, pandas dataframe
Calculate Total Sum in Pandas Dataframe
Get total sum from the crashes from the crashes_by_year Google Gemini AI will generate the following code to help:
total_crashes = crashes_by_year.sum()
print(total_crashes)
Now you have all of the crashes calculated in total number. With the new dataset, total crash number can be displayed.
Keywords: pandas sum function, sum code
Breakdown by Weather Condition in Pandas Dataframe
total number of records by year broken down by WEATHER_CONDITIONGoogle Gemini AI will generate the following code to help:
report = crashes_by_year.pivot(index='CRASH_YEAR', columns='WEATHER_CONDITION', values='COUNT')
print(report)
You can select these results by clicking an icon near the matrix of information and display a user friendly version, sortable by column.
Keywords: Google Gemini, Pivot Table, Data Report









Most people like



























Report
Please select a reason for reporting
- 13 Reasons to Switch from Snapchat to Text Messaging
- 7 Powerful Speech to Text Apps to Boost Productivity
- 10 Best Speech to Text Tools for Effortless Transcription
- 13 Free Tools to Easily Transcribe Audio to Text
- 15 Surprising Ways Google's Speech-to-Text Boosts Productivity
- 7 Best Free Online Audio to Text Transcription Tools
- 9 Tips to Transcribe Speech to Text Faster and Better
- 13 Best Speech to Text Software for Windows 10 in 2023
- 7 Tips for Choosing the Best Transcriber for Audio to Text
- 11 Reasons Why Dragon Speech-to-Text Apps are Game-Changers
- 6 Secrets to Enhance Your Speech to Text Transcription
- 6 Brilliant Ways to Boost Productivity with Talk-to-Text on Your MacBook
- 6 Ways Transcription Software Converts Audio to Text
- 8 Tips to Transcribe Speech to Text Like a Pro
- 6 Reasons IBM Watson Speech to Text is a Game-Changer
- 14 Powerful Ways Talk-to-Text Improves Your Workflow
- 12 Top Windows Speech-to-Text Software for Efficient Transcription
- 12 Game-Changing Benefits of Apple's Speech to Text Technology
- 9 Powerful Use Cases for AWS Speech to Text Technology
- 10 Easy Steps to Transcribe YouTube Videos to Text
- transcription audio en texte
- online audio transcription
- free audio file transcription
- free ai audio transcription
- audio transcription service
- audio transcription online free
- audio transcription free online
- audio to transcription software
- audio and transcript
- ai audio transcription free
- voice recording to text converter
- translate voice recording to text
- record voice to text
- audio recording to text converter
- voice recording and transcription
- chatgpt voice to text
- gmail voice to text
- speech to text reader
- speech to text ai free
- speech to talk
- Revolutionizing Storytelling: From Novels to Screenplays with AI
- Create Engaging Animated Explainer Videos with a Free AI Tool
- Stop Multi-Subscribing: Benchmark Top AI Visual Models in One Canvas
- Best Seedance 2.5 API Provider: Every Price on the Market, Checked at Source
- AI OnlyFans: How to Generate $30,000/Month (Legally)
- Transform Your Script into an Engaging Video with AI Video Maker!
- AI Marketing Automation: A Comprehensive Guide for Small Businesses
- Midjourney Alternative for Anime Art Creators: Why PixAI May Be Better for Character Workflows
- 10 Things Most People Get Wrong About AI Image Search
- AI Girlfriend Apps: Top Choices Redefining Relationships 2025
- Python Random Name Generator Tutorial
- Generate Unique Names with Python Random Name Generator
- Code a JavaScript Name Generator
- Create a Fun Name Generator App - Easy JavaScript Project!
- Experience Roblox's Avatar Creation for Karl Jacobs!
- May TBR Game: How a Letter Generator Chooses My Reads
- AI Celebrity Chat: Hilarious Pick-Up Lines & Chatbot Chaos!
- Embrace Chaos with the Random Makeup Challenge
- Boost Audience Engagement with the Wheel of Names
- Engage Your Audience with the Wheel of Names!

Copyright ©2026 toolify