































Table of Contents
- Key Points
- Fundamentals of Constraint Satisfaction Problems
- Creating a Constraint Graph
- Step-by-Step Guide to Creating a Constraint Graph
- Pricing
- Pros and Cons of Using Constraint Graphs
- Core Features
- Use Cases
- FAQ
- Related Questions



Fundamentals of Constraint Satisfaction Problems
What is a Constraint Satisfaction Problem (CSP)?
A Constraint Satisfaction Problem (CSP) involves finding a solution from a set of variables that satisfy specific constraints. CSPs are ubiquitous in various fields, including artificial intelligence, operations research, and software engineering. Understanding CSPs is crucial for solving complex problems that require satisfying multiple conditions simultaneously. The basic components of a CSP are:
- Variables: These are the entities that need to be assigned values.
- Domains: Each variable has a domain, which is the set of possible values that the variable can take.
- Constraints: These are the rules or conditions that restrict the values that variables can be assigned.
The goal in a CSP is to find an assignment of values to all variables such that all constraints are satisfied.
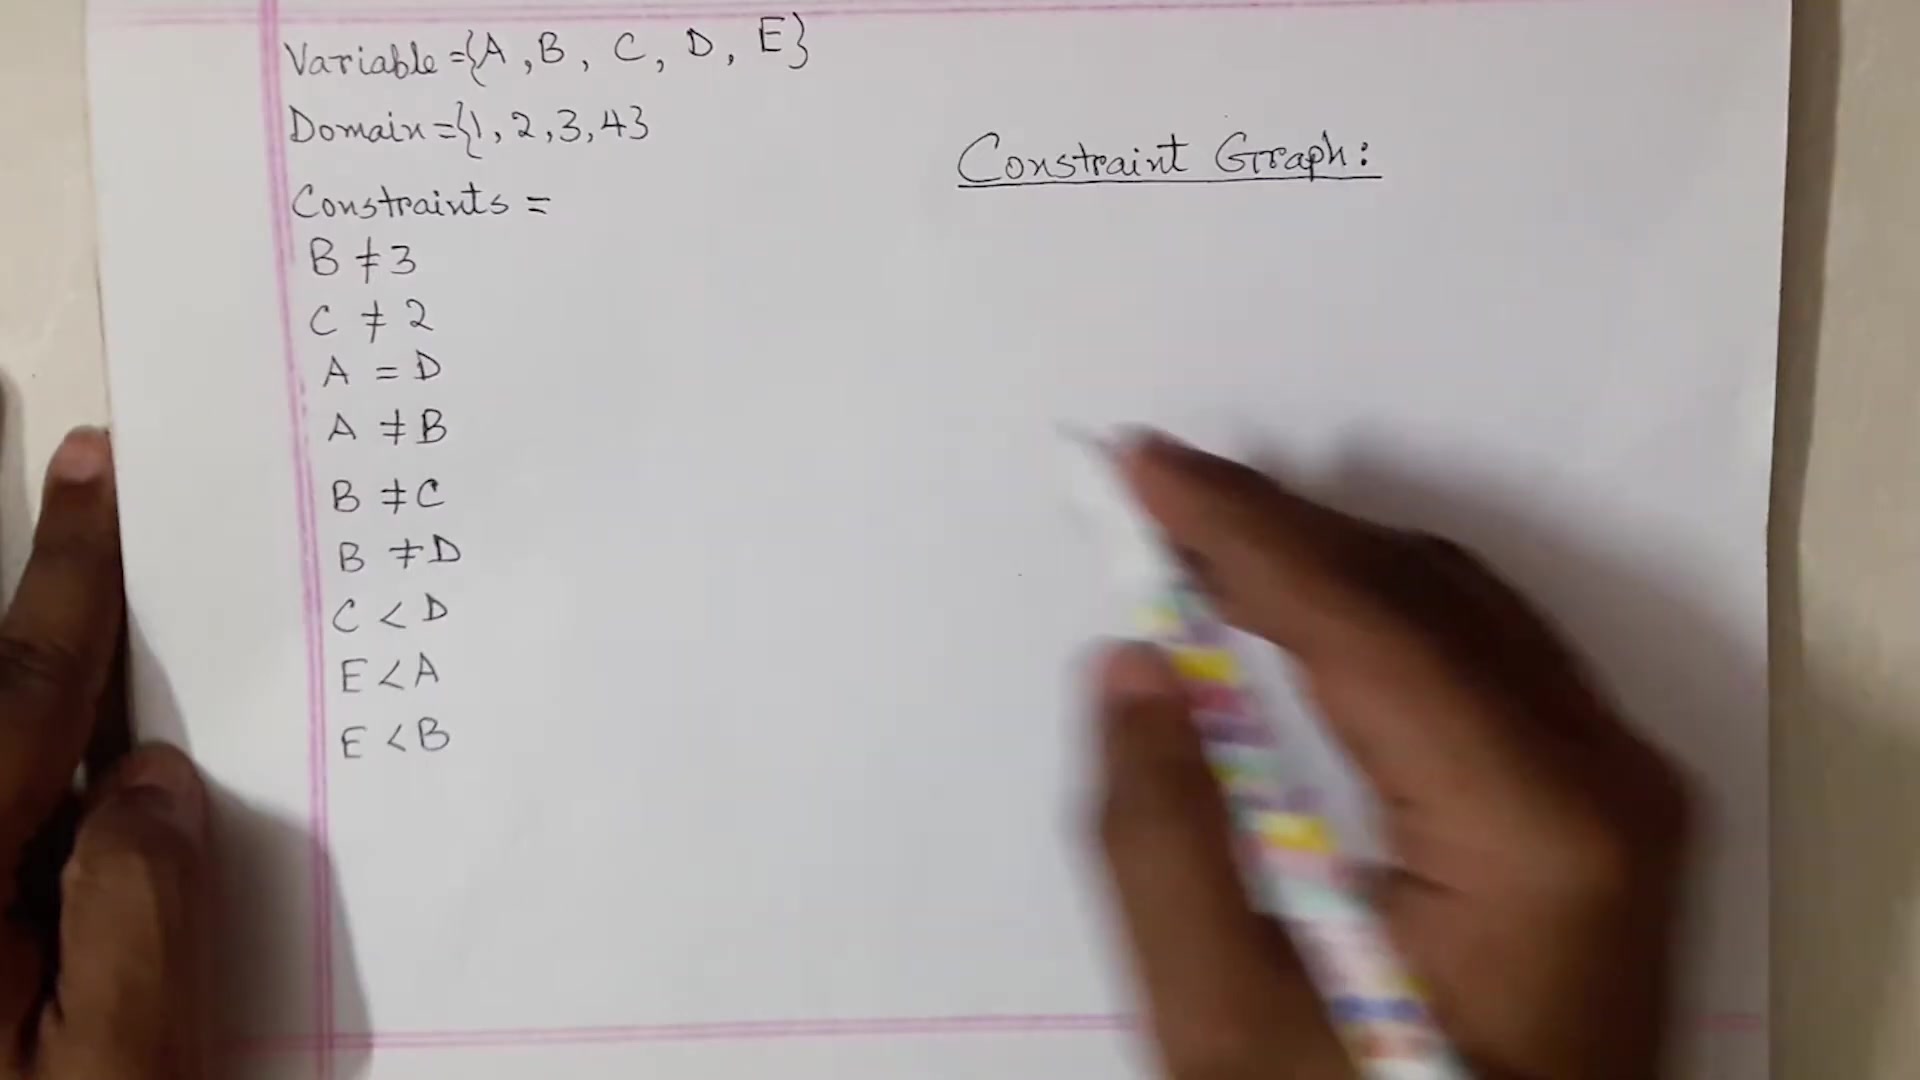
This assignment represents a solution to the problem. For instance, in a Scheduling problem, variables might represent tasks, domains might represent time slots, and constraints might represent precedence relationships between tasks. By formulating the problem as a CSP, we can apply various algorithms to find a feasible schedule that meets all requirements.
Defining Variables and Domains
Variables are the core elements of a CSP. Each variable represents an unknown whose value we need to determine. Variables are often denoted by letters like A, B, C, etc. In our example, we have variables A, B, C, D, and E. Each variable is associated with a domain, which is the set of possible values that the variable can take. The domain can be a set of numbers, symbols, or any other type of data.
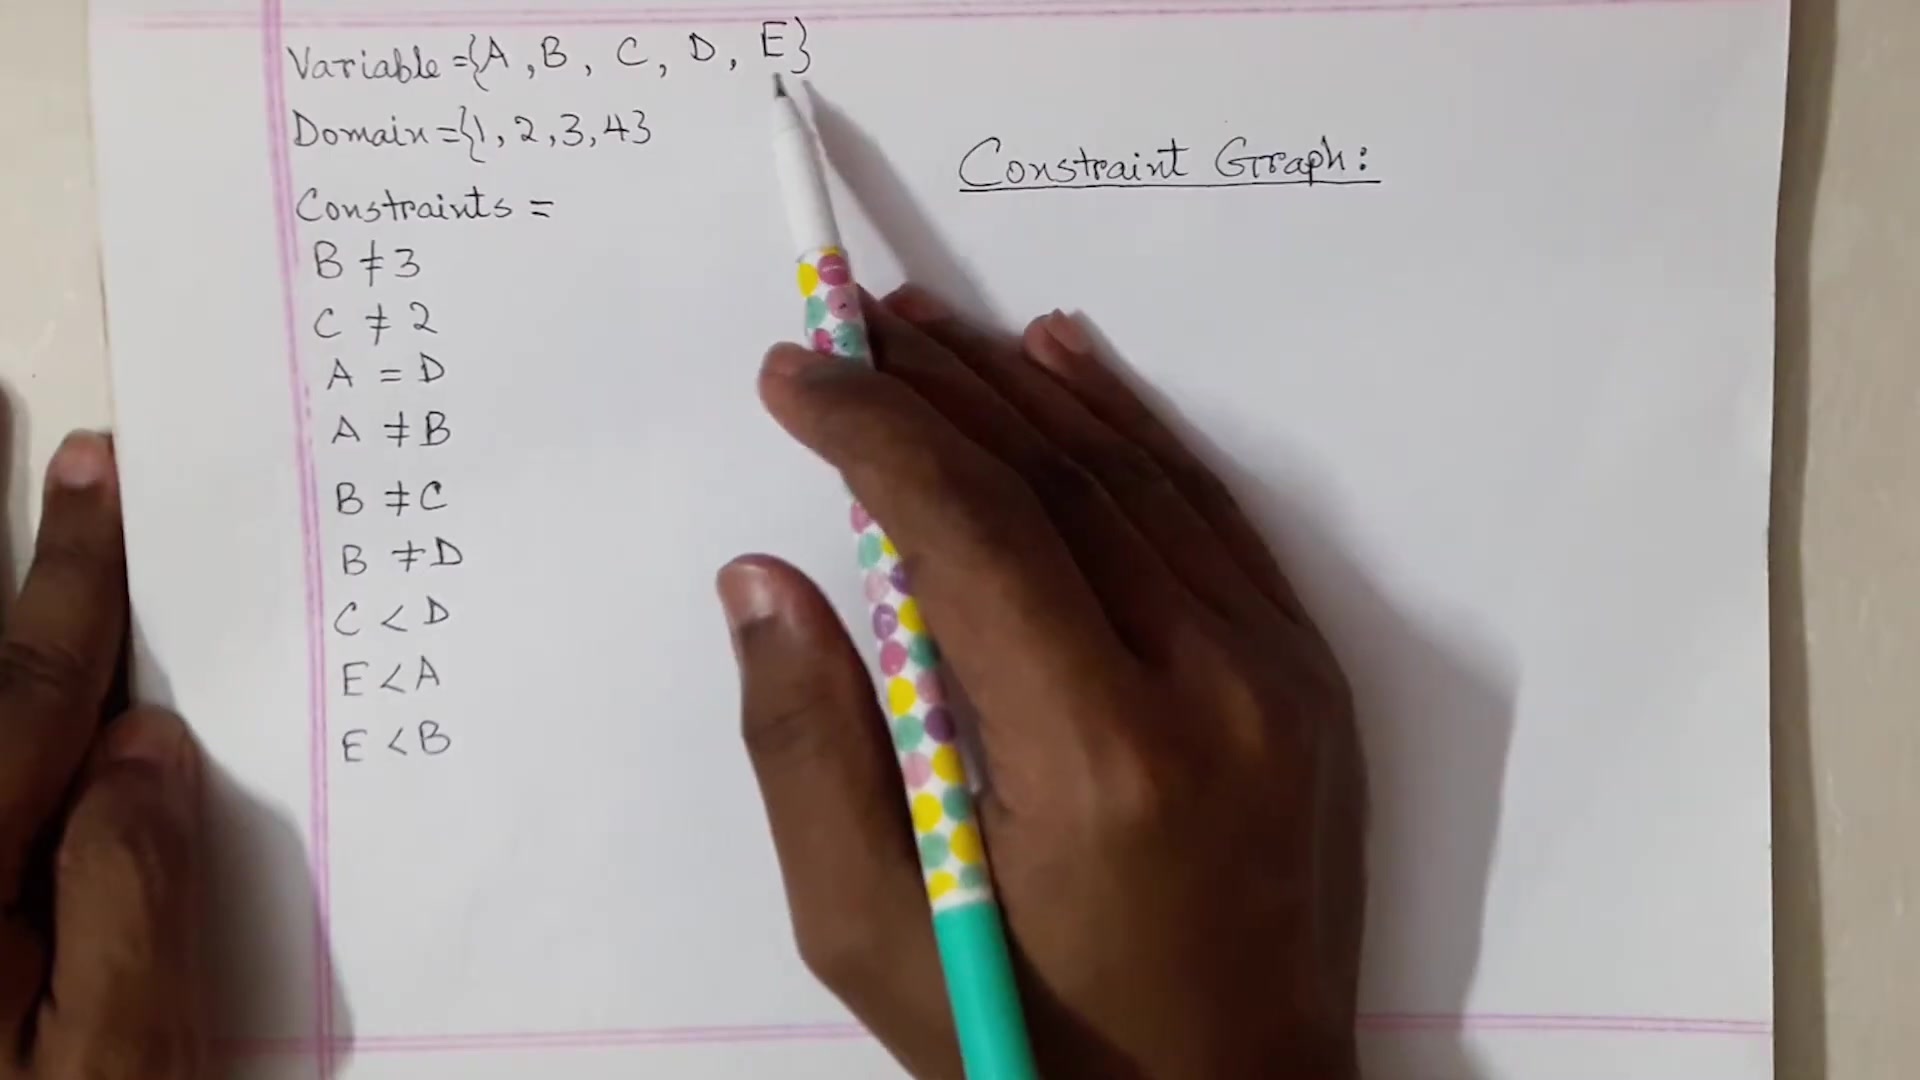
For example, the domain might be {1, 2, 3, 4}. This means that each variable can be assigned one of these four values.
When defining variables and their domains, it is crucial to ensure that the domain accurately reflects the possible values for each variable. A well-defined domain simplifies the problem-solving process by limiting the search space. For instance, if a variable represents the number of employees needed for a task, its domain should consist of non-negative integers. By clearly defining variables and their domains, we lay the groundwork for formulating constraints and finding a solution to the CSP.
Understanding Constraints
Constraints are the rules that define the relationships between variables. They specify which combinations of values are allowed and which are not. Constraints are essential for capturing the requirements of the problem and ensuring that any solution is valid. Constraints can be expressed in various forms, such as mathematical equations, logical statements, or symbolic rules.
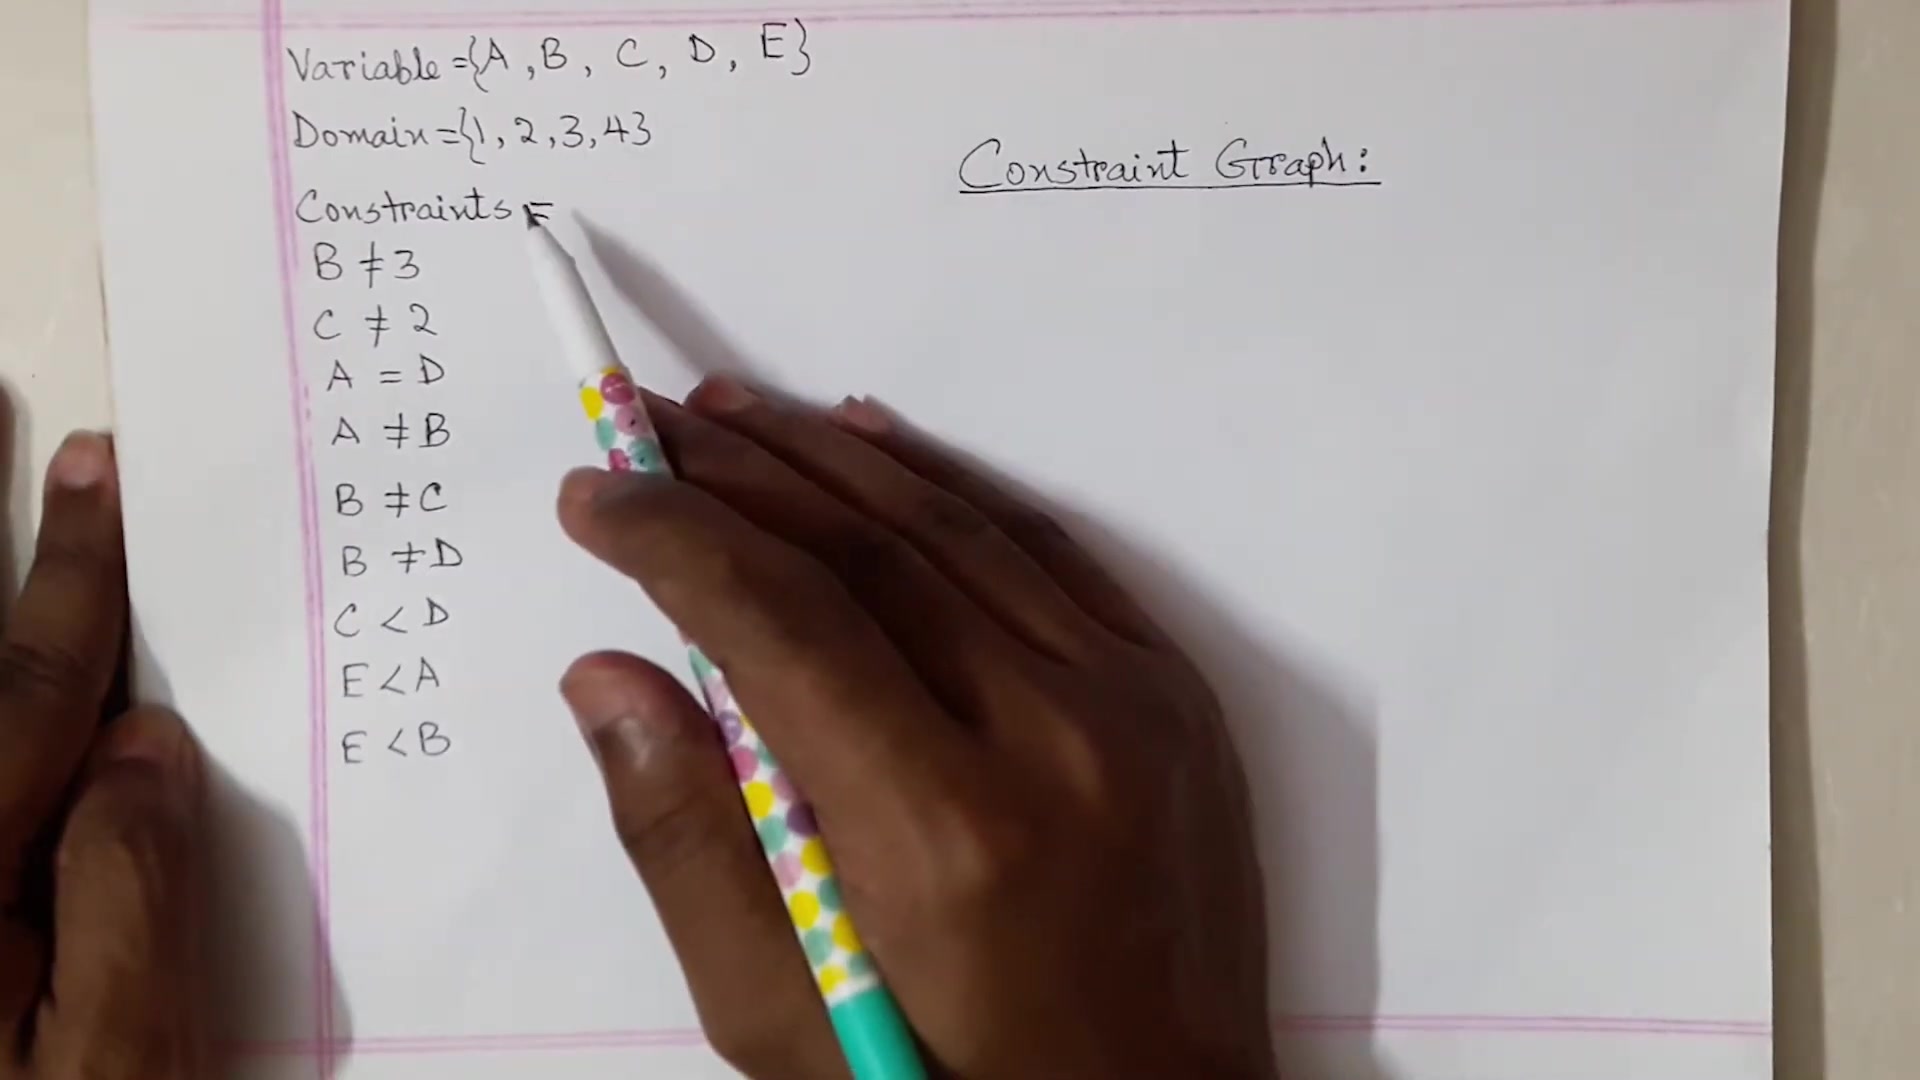
Some common types of constraints include:
- Equality constraints: These constraints specify that two variables must have the same value (e.g., A = D).
- Inequality constraints: These constraints specify that two variables must have different values (e.g., A ≠ B).
- Range constraints: These constraints specify that a variable must fall within a certain range (e.g., C < D).
In our example, we have constraints such as B ≠ 3, C ≠ 2, A = D, A ≠ B, B ≠ C, B ≠ D, C < D, E < A, and E < B. These constraints collectively define the conditions that must be satisfied. Understanding and accurately formulating constraints is crucial for successfully solving a CSP.
Creating a Constraint Graph
Steps to Build a Constraint Graph
A constraint graph is a visual representation of a CSP. It consists of nodes representing variables and edges representing constraints between them. Building a constraint graph can help you better understand the structure of the problem and identify potential solution strategies. Here’s how to construct a constraint graph:
-
Represent Variables as Nodes: For each variable in the CSP, create a node in the graph. Label each node with the name of the variable. In our example, we would create nodes for A, B, C, D, and E.

-
Represent Constraints as Edges: For each constraint involving two variables, draw an edge between the corresponding nodes. Label the edge with the constraint. If the constraint is an equality constraint (e.g., A = D), you can use a single edge. If the constraint is an inequality constraint (e.g., A ≠ B) or a range constraint (e.g., C < D), you can use a directed edge to indicate the direction of the constraint.
-
Simplify the Graph: After adding all the nodes and edges, simplify the graph by removing redundant edges and combining nodes that are equivalent due to equality constraints. This simplification can make the graph easier to analyze and understand.
By following these steps, you can create a constraint graph that visually represents the structure of the CSP. This graph can then be used to apply various graph-based algorithms for solving the CSP.
Analyzing Constraint Graphs for Problem Solving
Once you have created a constraint graph, you can use it to analyze the CSP and identify potential solution strategies. The structure of the graph can reveal important information about the problem, such as the degree of connectivity between variables and the presence of cycles. Analyzing the graph involves:
- Identifying Connected Components: A connected component is a subgraph in which every node is reachable from every other node. Identifying connected components can help you decompose the problem into smaller, independent subproblems.
- Detecting Cycles: A cycle is a path in the graph that starts and ends at the same node. Cycles can introduce dependencies between variables, making the problem more difficult to solve. Breaking cycles or using cycle-consistent algorithms can help overcome this challenge.
- Evaluating Node Degrees: The degree of a node is the number of edges connected to it. Nodes with high degrees are involved in many constraints, making them critical for finding a solution. Focusing on these nodes can help you narrow down the search space and improve the efficiency of your problem-solving efforts.
By carefully analyzing the constraint graph, you can gain valuable insights into the structure of the CSP and develop effective strategies for finding a solution. This analysis can involve both visual inspection of the graph and the application of graph-based algorithms.
Step-by-Step Guide to Creating a Constraint Graph
Step 1: Define Variables and Domains
Begin by clearly identifying the variables involved in your problem and specifying their respective domains. For example, if you are scheduling tasks, the variables might be the tasks themselves, and the domains might be the available time slots. Ensure that each variable has a well-defined domain that accurately reflects the possible values it can take. This step is crucial for setting the stage for formulating constraints and building the constraint graph. Consider a Scenario where you need to assign colors to regions on a map.
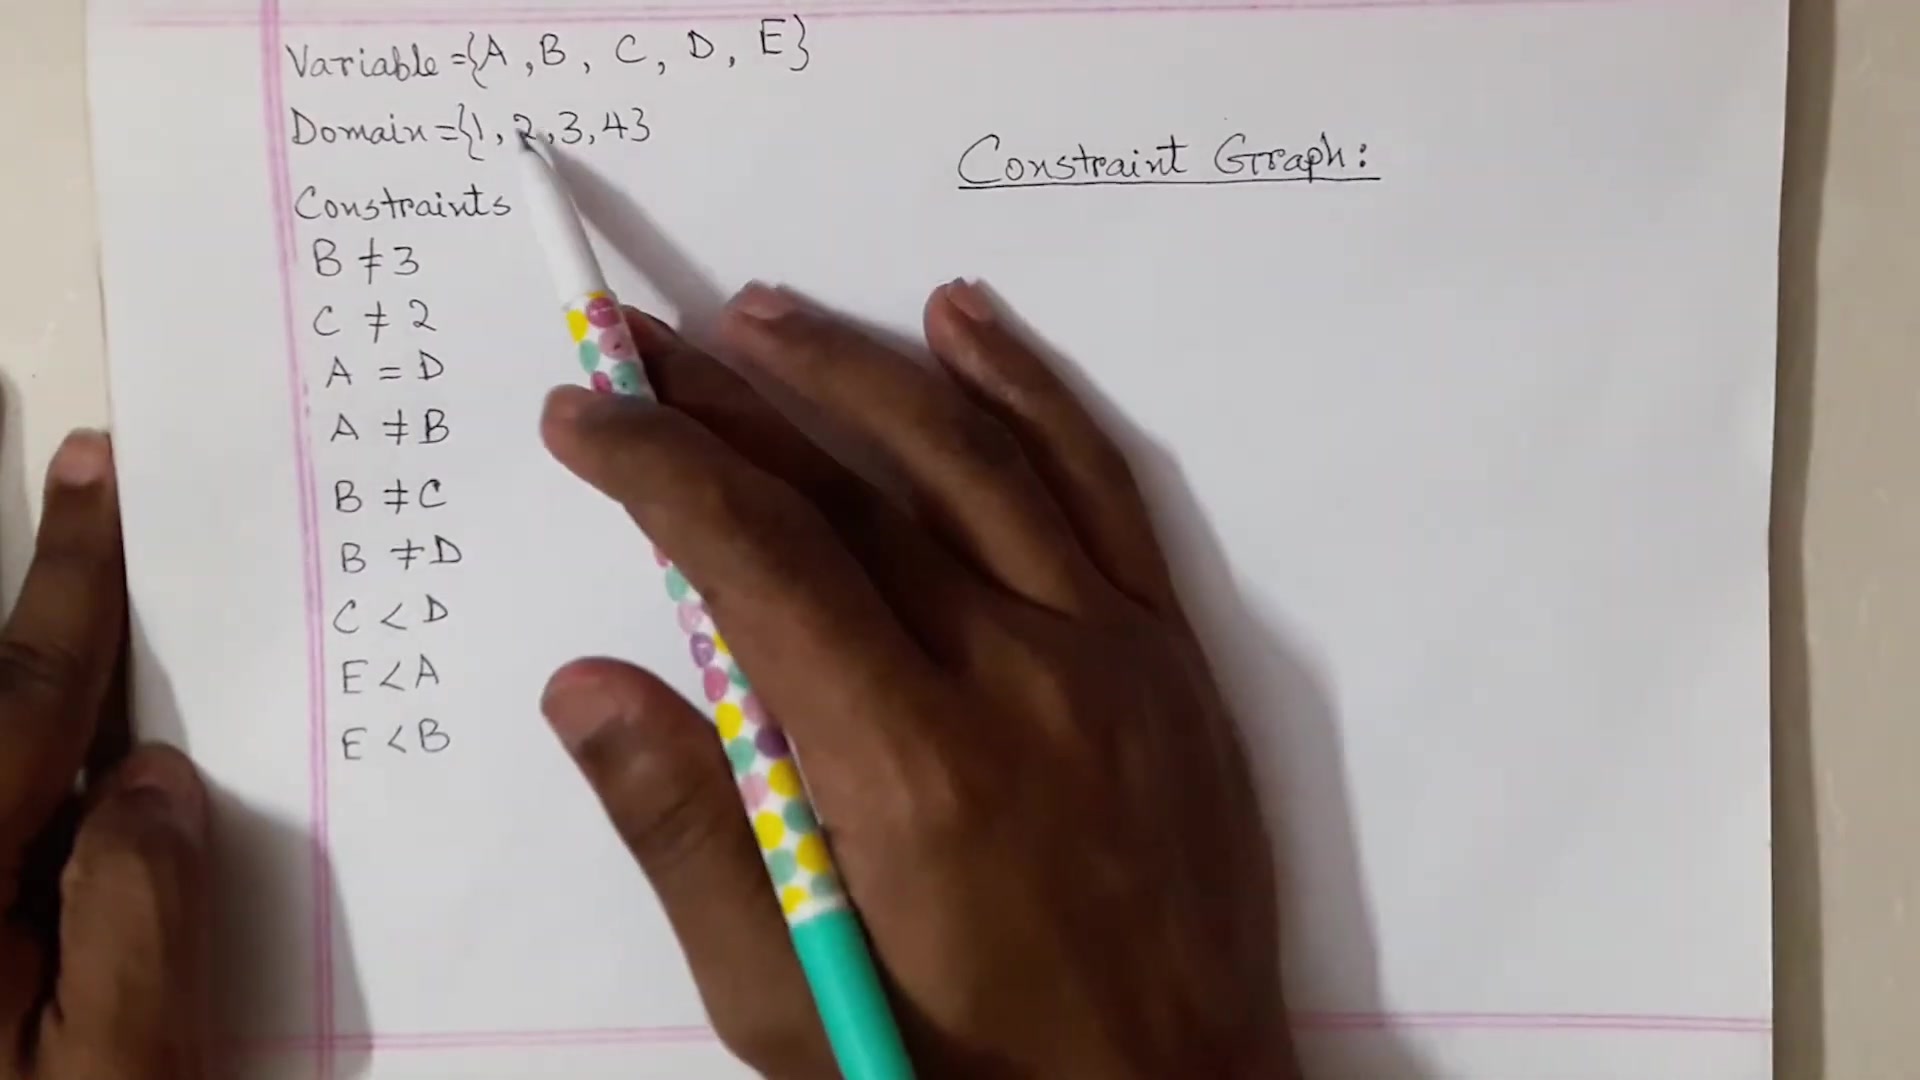
The variables would be the regions, and the domains would be the available colors. Accurate definition here simplifies subsequent steps.
Step 2: Formulate Constraints
Next, formulate the constraints that govern the relationships between the variables. Constraints define which combinations of values are allowed and which are not. Express constraints in a clear and precise manner, using mathematical equations, logical statements, or symbolic rules. Consider constraints such as equality (A = D), inequality (A ≠ B), and range constraints (C < D). In the map coloring example, a constraint would be that adjacent regions cannot have the same color. Ensure that all Relevant constraints are captured to accurately represent the problem. This step ensures that any solution found is valid and meets all requirements.
Step 3: Draw the Constraint Graph
Now, create the constraint graph. Represent each variable as a node in the graph. For each constraint involving two variables, draw an edge between the corresponding nodes. Label each edge with the constraint it represents. Use different types of edges to distinguish between different types of constraints. For example, a single edge can represent equality constraints, while directed edges can represent inequality or range constraints. Ensure that the graph accurately reflects the relationships between variables as defined by the constraints. This visual representation provides a clear overview of the problem structure, making it easier to analyze and solve.
Step 4: Analyze and Simplify the Graph
After drawing the constraint graph, analyze its structure to identify potential solution strategies. Look for connected components, cycles, and nodes with high degrees. Simplify the graph by removing redundant edges and combining equivalent nodes. Use graph-based algorithms to identify potential solutions or decompose the problem into smaller subproblems. Analyzing and simplifying the graph can significantly improve the efficiency of your problem-solving efforts. For example, identifying independent subgraphs allows you to solve each subgraph separately and then combine the solutions to obtain a solution for the entire problem.





Most people like







































Report
Please select a reason for reporting
- 13 Reasons to Switch from Snapchat to Text Messaging
- 7 Powerful Speech to Text Apps to Boost Productivity
- 10 Best Speech to Text Tools for Effortless Transcription
- 13 Free Tools to Easily Transcribe Audio to Text
- 15 Surprising Ways Google's Speech-to-Text Boosts Productivity
- 7 Best Free Online Audio to Text Transcription Tools
- 9 Tips to Transcribe Speech to Text Faster and Better
- 13 Best Speech to Text Software for Windows 10 in 2023
- 7 Tips for Choosing the Best Transcriber for Audio to Text
- 11 Reasons Why Dragon Speech-to-Text Apps are Game-Changers
- 6 Secrets to Enhance Your Speech to Text Transcription
- 6 Brilliant Ways to Boost Productivity with Talk-to-Text on Your MacBook
- 6 Ways Transcription Software Converts Audio to Text
- 8 Tips to Transcribe Speech to Text Like a Pro
- 6 Reasons IBM Watson Speech to Text is a Game-Changer
- 14 Powerful Ways Talk-to-Text Improves Your Workflow
- 12 Top Windows Speech-to-Text Software for Efficient Transcription
- 12 Game-Changing Benefits of Apple's Speech to Text Technology
- 9 Powerful Use Cases for AWS Speech to Text Technology
- 10 Easy Steps to Transcribe YouTube Videos to Text
- transcription audio en texte
- online audio transcription
- free audio file transcription
- free ai audio transcription
- audio transcription service
- audio transcription online free
- audio transcription free online
- audio to transcription software
- audio and transcript
- ai audio transcription free
- voice recording to text converter
- translate voice recording to text
- record voice to text
- audio recording to text converter
- voice recording and transcription
- chatgpt voice to text
- gmail voice to text
- speech to text reader
- speech to text ai free
- speech to talk
- How SEO and Marketing Dashboards Empower Agencies to Drive Results
- How to Use AI Tools to Find Internal Linking Opportunities Across a Business Website
- Discover Your Perfect Haircut with AI Hairstyle Apps
- Free Reputation Calculator Tools: How They're Adapting to Score AI Visibility, Not Just Rankings
- Design Professional Flyers for Free on Your Phone
- Best Free Flyer Maker Apps for Android: Design Like a Pro
- How to Know If Your Business Is Ready for an AI Customer Service Agent
- Revolutionizing Storytelling: From Novels to Screenplays with AI
- Create Engaging Animated Explainer Videos with a Free AI Tool
- Stop Multi-Subscribing: Benchmark Top AI Visual Models in One Canvas
- An Objective Look at Modern Web-Based Visual Modifications
- My Honest Experience with VideoAI: The Secret Weapon for Creators Who Need Character Voices
- 5 Data Problems That Stall AI Projects in Financial Compliance
- Master Storyboard Drawing: Expert Tips for Non-artists
- The Future of Smart Glasses: Explained & Assembling Guide
- DeepL Translator: The AI-Powered Translation Tool
- AI Video Upscaling: Top Tools Compared for Enhanced Quality
- Bridging the Gap: How One Indie Developer Solved the "Art Asset Nightmare" Using AI Style Transfer
- How I Direct Consistent AI Clips: A Hands-On Guide to Multi-Model Generation
- My Honest Review of VideoAI: The Ultimate Character Voice Generator I've Been Using Lately

Copyright ©2026 toolify