


Minicule
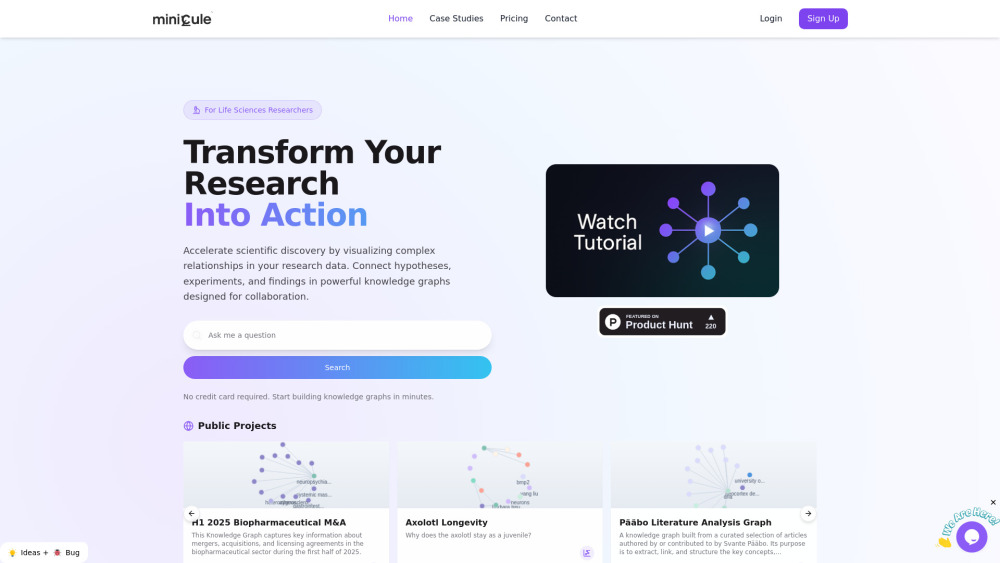


What is Minicule?
Minicule is an AI-powered research web application designed for life sciences researchers. It connects to major scientific databases like PubMed, OpenAlex, and USPTO, enabling users to build scientific knowledge graphs, explore dendrograms, and accelerate evidence verification. The platform helps transform complex research data into clear, actionable knowledge graphs, facilitating the visualization and acceleration of scientific discovery by mapping relationships between hypotheses, experiments, and findings.
How to use Minicule?
Users can start building knowledge graphs by connecting to data from PubMed, OpenAlex, and USPTO. The platform allows researchers to visualize complex relationships in their data, map hypotheses, experiments, and findings, and collaborate with colleagues by sharing knowledge graphs. It offers custom workspaces for individual researchers and teams, and domain-specific visualization templates for biotech, genomics, and pharmaceutical research.
Minicule's Core Features
AI-powered scientific knowledge graph creation
Connection to PubMed, OpenAlex, and USPTO
Visualization of complex research data relationships
Collaborative insights and sharing of knowledge graphs
Secure data handling with privacy controls
Quantifiable results visualization
Team-based workflows and custom workspaces
Specialized templates for life sciences (biotech, genomics, pharma)
Advanced knowledge graph features
Unlimited publication search
Private mode for projects
Team sharing & collaboration
Custom deployment options (Enterprise)
Bring Your Own LLM Keys (Enterprise)
Run Privately with Docker Deployment (Enterprise)
Run Unlimited AI agents for IP and R&D (Enterprise)
Minicule's Use Cases
Accelerating scientific discovery by visualizing complex relationships in research data.
Mapping complex relationships between research data points to identify patterns and correlations.
Sharing knowledge graphs with colleagues and collaborators for multi-institution research.
Visualizing experimental outcomes alongside hypotheses to understand efficacy.
Connecting gene expression data with clinical outcomes in genomics research.
Exploring specific research topics like Axolotl Longevity, Pääbo Literature Analysis, AAV Gene Therapy Vectors in Neurological Diseases, Rifaximin and Neuroinflammation in ALS, Biomarkers for Immunotherapy Response, and Parkinson’s Disease Therapeutic Innovations.
FAQ from Minicule
What is Minicule?
What data sources does Minicule connect to?
Is there a free version of Minicule available?
Does Minicule offer discounts for academic researchers?
Can I collaborate with my team using Minicule?
What are 'Tokens' in Minicule's pricing plans?
Can Minicule be deployed privately?
Minicule Support Email & Customer service contact & Refund contact etc.
More Contact, visit the contact us page(https://minicule.com/contact)
Minicule Company
Minicule Company name: Minicule .
Minicule Company address: 310 Hunt Club, Suite 200, Ottawa, Canada, K1V 1C1.
More about Minicule, Please visit the about us page(https://minicule.com/about).
Minicule Login
Minicule Login Link: https://minicule.com/auth
Minicule Sign up
Minicule Sign up Link: https://minicule.com/auth?mode=signup
Minicule Linkedin
Minicule Linkedin Link: https://www.linkedin.com/company/minicule
Minicule Twitter
Minicule Twitter Link: https://twitter.com/minicule
Minicule Github
Minicule Github Link: https://github.com/minicule
Minicule Reviews (0)
Minicule Pricing
Free
$0 /month
Individual researchers getting started. Includes 1 Million Tokens per month, Basic knowledge graph visualization, Limited publication search, 1 GB Storage, Basic timeline view, Public Mode (Projects are publicly visible).
Pro
$49.00 /month
Active researchers and small labs needing privacy. Includes 10 Million Tokens, Everything in Free, plus Private Mode (Projects are private), Advanced knowledge graph features, Unlimited publication search, 25 GB Storage.
Team
$99.00 /month
Research organizations needing collaboration. Includes 10 Million Tokens, Everything in Pro, plus Team Sharing & Collaboration features, Includes 20 seats ($5/additional seat), 50 GB Storage, Priority Support.
Enterprise
Custom solutions
For large organizations with specific security, compliance, and integration requirements. Minimum commitment: $60,000 USD per year. Includes Everything in Team, plus custom deployment options, Bring Your Own LLM Keys (Gemini, OpenAI, Llama, Claude), Run Privately with Docker Deployment, Dedicated support with 12-hour response time, Run Unlimited AI agents for IP and R&D.
Analytic of Minicule
Minicule Website Traffic Analysis
Geography
Top 2 Regions


Minicule Launch embeds
Use website badges to drive support from your community for your Toolify Launch. They're easy to embed on your homepage or footer.



Alternative of Minicule
 37.22%
Social Listening