































Table of Contents
- Key Points
- Graphing Linear Equations and Identifying Solutions
- Solving Linear Equations with Parentheses
- Steps on How to Use Linear Equations
- Advantages and Disadvantages of Graphing Linear Equations
- FAQ
- Related Questions


Graphing Linear Equations and Identifying Solutions
Understanding Slope-Intercept Form
The slope-intercept form of a linear equation, y = mx + b, provides a straightforward method for graphing lines. Here, 'm' represents the slope, indicating the line's steepness and direction, and 'b' represents the y-intercept, the point where the line crosses the y-axis. Understanding these components allows for quick and accurate graphing.
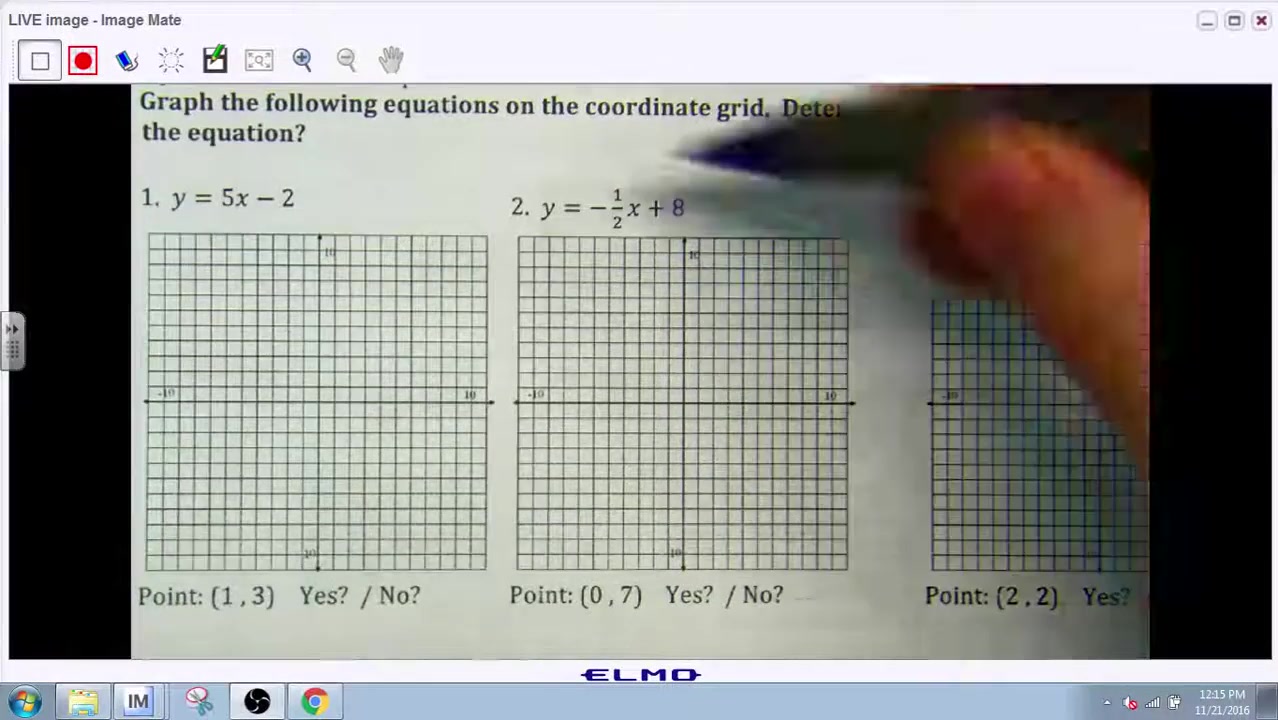
The slope, often referred to as 'rise over run', dictates how much the y-value changes for every unit change in the x-value. A positive slope indicates an upward climb from left to right, while a negative slope signifies a downward trend. The y-intercept pinpoints the exact location where the line intersects the vertical axis, providing a fixed point to start the graph.
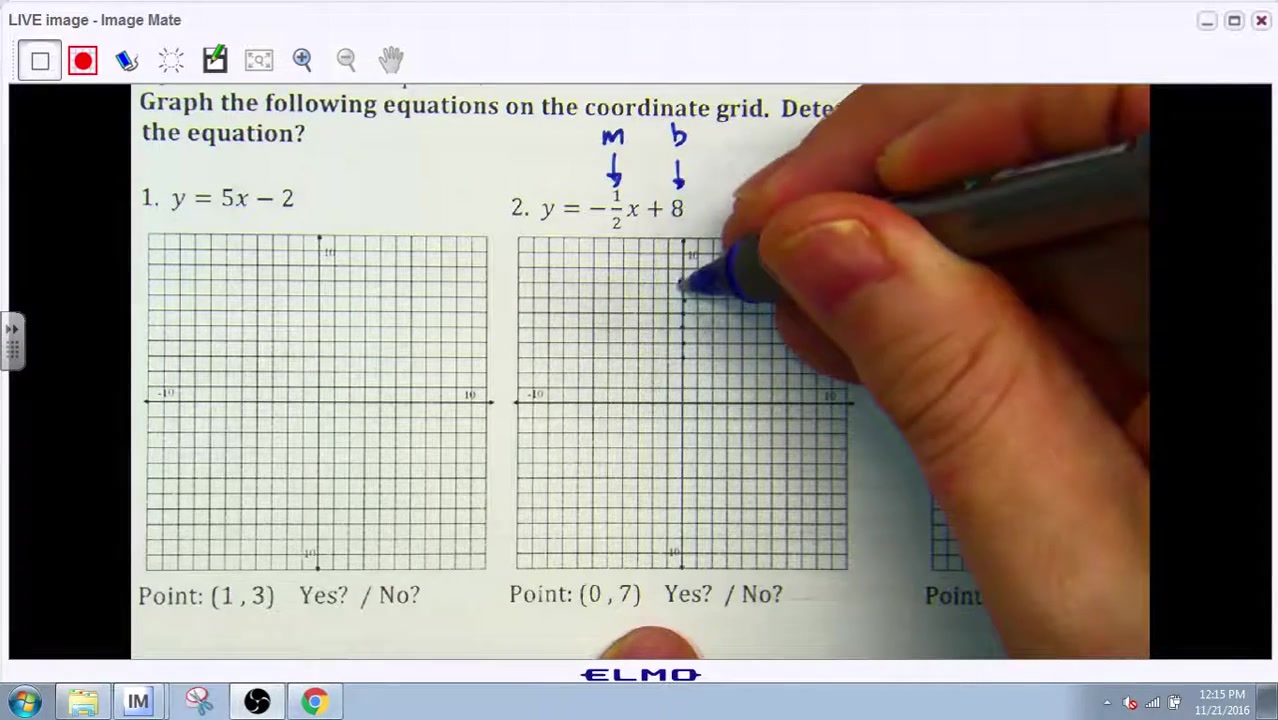
Example: Consider the equation y = -1/2x + 8. Here, the slope (m) is -1/2, and the y-intercept (b) is 8. This tells us that for every 2 units we move to the right on the x-axis, the y-value decreases by 1. The line crosses the y-axis at the point (0, 8). This information is crucial for accurately plotting the line on a coordinate grid.The Y-intercept is crucial for plotting the first point, the slope is the key to identifying other subsequent points. Understanding is the key to graphing linear equations.
Graphing the Equation y = -1/2x + 8
To graph the equation y = -1/2x + 8, begin by plotting the y-intercept at (0, 8). This is your starting point on the coordinate grid. From this point, use the slope (-1/2) to find additional points. A slope of -1/2 means you move down 1 unit and right 2 units to find the next point. Continue this process to plot several points. Once you have a few points, draw a straight line through them, extending the line across the grid.
This line represents all possible solutions to the equation y = -1/2x + 8.
Here's a step-by-step breakdown:
- Plot the Y-Intercept: Locate (0,8) on the coordinate plane.
- Apply the Slope: From (0,8), go down 1 unit and right 2 units to reach (2,7). Plot this point.
- Repeat: Repeat the process to find additional points like (4,6), (6,5), and so on.
- Draw the Line: Connect the points with a straight line. This line is the visual representation of the linear equation. Ensure the line extends beyond the plotted points to indicate that the solutions continue infinitely in both directions. Visualizing these steps helps students and professionals to graph linear equations with precision.
Determining if a Point is a Solution
Once you have graphed the linear equation, you can visually determine if a given point is a solution. If the point lies on the line, it is a solution to the equation. If the point is not on the line, it does not satisfy the equation and is not a solution. This graphical method offers a quick way to check potential solutions.
Example: Is the point (0, 7) a solution to y = -1/2x + 8? Locate the point (0, 7) on the graph.
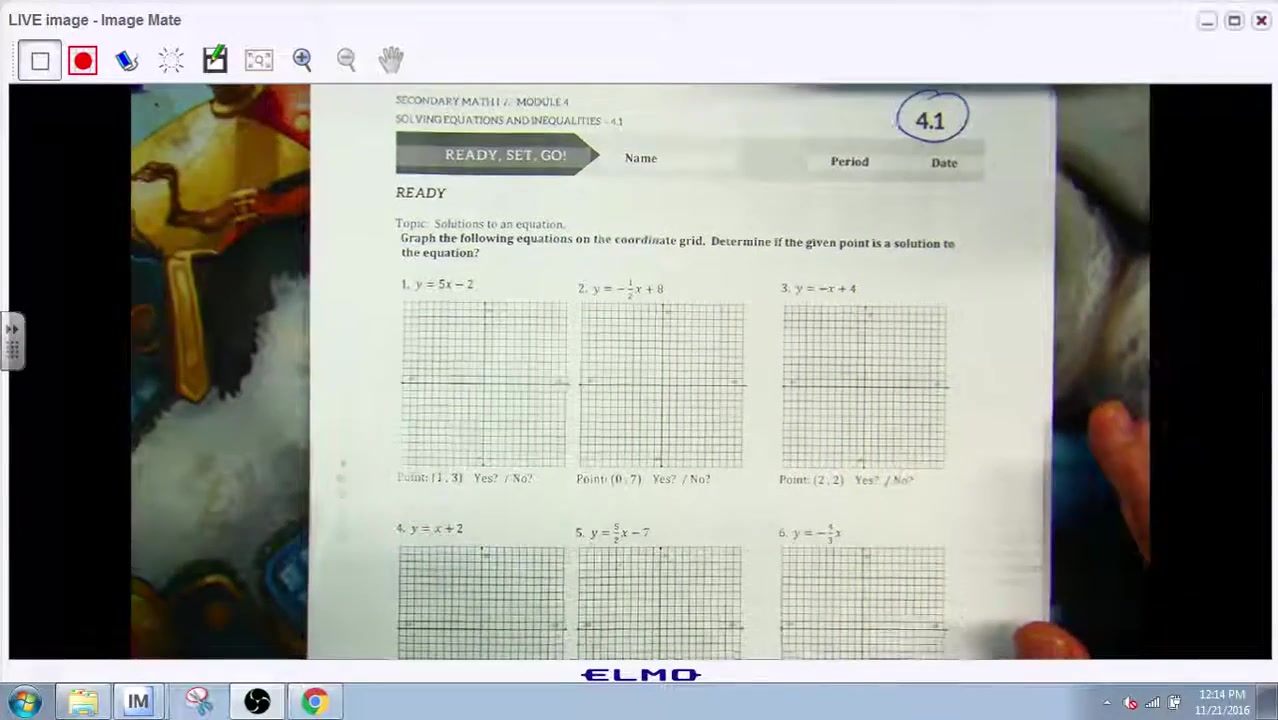
If (0,7) does not lie on the line, then (0,7) is not a solution. Remember, for a point to be a solution, it must perfectly align with the graphed line. If it does not then it does not work.
Algebraic Verification:
In addition to the graphical method, you can algebraically verify if a point is a solution by substituting the x and y values of the point into the equation. If the equation holds true after the substitution, the point is a solution. If it does not, the point is not a solution. This algebraic check provides a precise confirmation.
Example: To check if (0, 7) is a solution to y = -1/2x + 8, substitute x = 0 and y = 7 into the equation: 7 = -1/2(0) + 8. Simplify the equation: 7 = 0 + 8. Further simplify: 7 = 8. Since 7 does not equal 8, the point (0, 7) is not a solution. Using both graphical and algebraic methods ensures a comprehensive understanding of linear equation solutions. The table below shows a comparison of how to use algebraic and graphical methods.
| Method | Process | Outcome |
|---|---|---|
| Graphical | Plot the line and the point; check if the point is on the line. | If the point is on the line, it's a solution; otherwise, it's not. |
| Algebraic | Substitute the point's coordinates into the equation. | If the equation holds true, it's a solution; if it doesn't, it's not. |
Solving Linear Equations with Parentheses
Applying the Distributive Property
Linear equations often include parentheses, requiring the use of the distributive property to simplify them. The distributive property states that a(b + c) = ab + ac. In other words, you multiply the term outside the parentheses by each term inside the parentheses. This step is crucial for removing the parentheses and proceeding with solving the equation. If you skip this step it will affect the accuracy of the result. Also, keep track of negative signs for the most accurate outcome.
Example: Simplify the expression 3(w - 9) / 5. Apply the distributive property: (3 w - 3 9) / 5. This simplifies to (3w - 27) / 5. This step eliminates the parentheses and sets up the expression for further simplification.
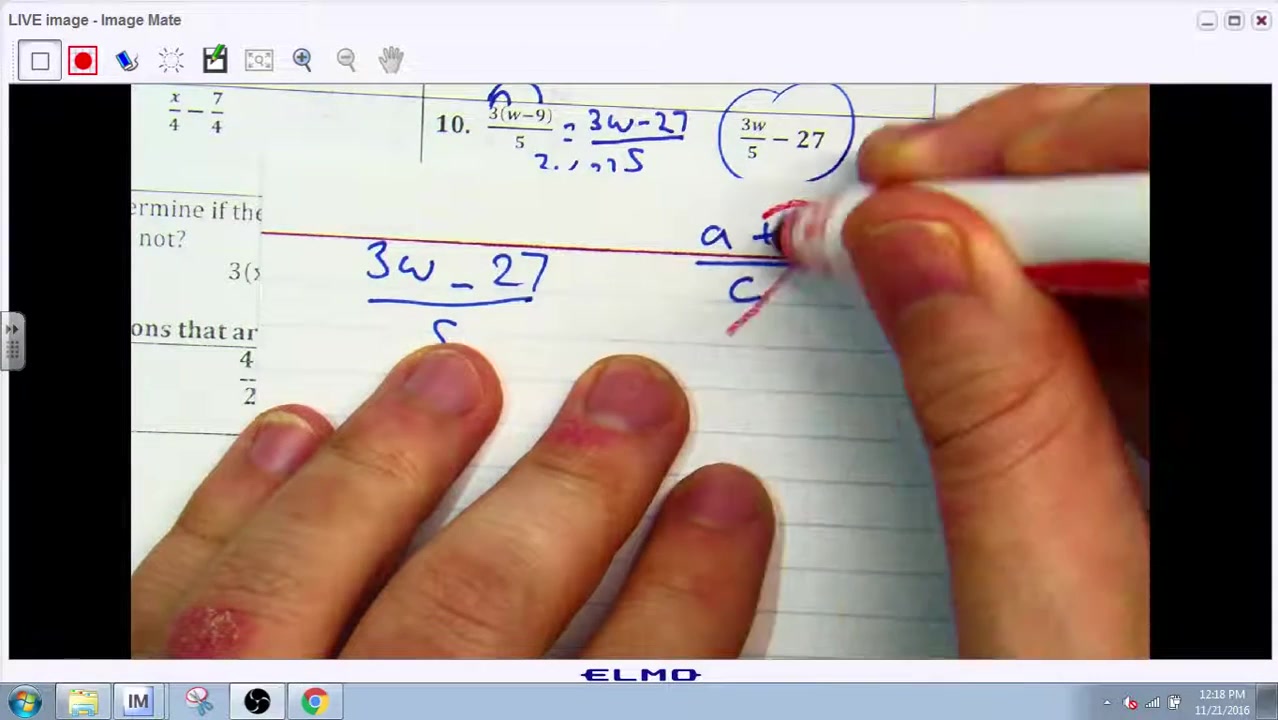
Learning these tools allows for equations to be solved with ease.
Evaluating Equivalence After Distribution
Once you've applied the distributive property, the next step is to evaluate whether the resulting expression is equivalent to another given expression. This involves comparing the simplified forms of both expressions to see if they are identical. If the simplified expressions are the same, the original equations are equivalent. A clear method of demonstrating the equal outcomes of both sides is key.
Example: Determine if (3(w - 9) / 5) is equivalent to (3w / 5) - 27. After distributing, the first expression simplifies to (3w - 27) / 5. To assess equivalence, split this into (3w / 5) - (27/5). Comparing this to (3w / 5) - 27 reveals they are not the same because the 27 is not being divided by 5 in both sides. These methods of evaluating are key for accuracy and correct results.
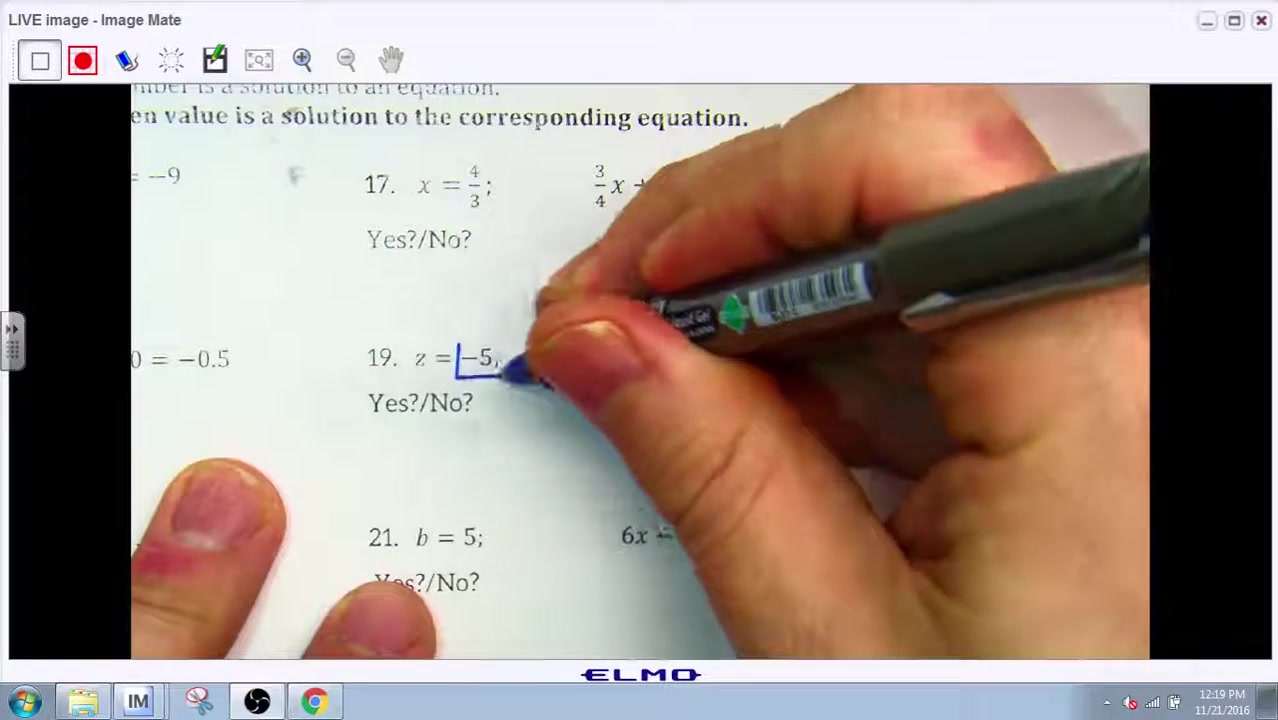
In these types of mathematical evaluations, it is easy to be tripped up.
Understanding Binomials
In algebra, a binomial is an expression with two terms, such as 3w - 27. When a binomial is divided by a single term, like 5 in the expression (3w - 27) / 5, you can split the binomial into two separate fractions. This allows you to simplify each term individually, making the expression easier to manage. Binomials are found in many different levels of math from basic to advanced, so understanding the foundations can help ensure the ability to solve complicated problems.
Example: Split the binomial (3w - 27) / 5 into two fractions: (3w / 5) - (27 / 5). This separation allows you to handle each term independently, potentially simplifying the overall expression.
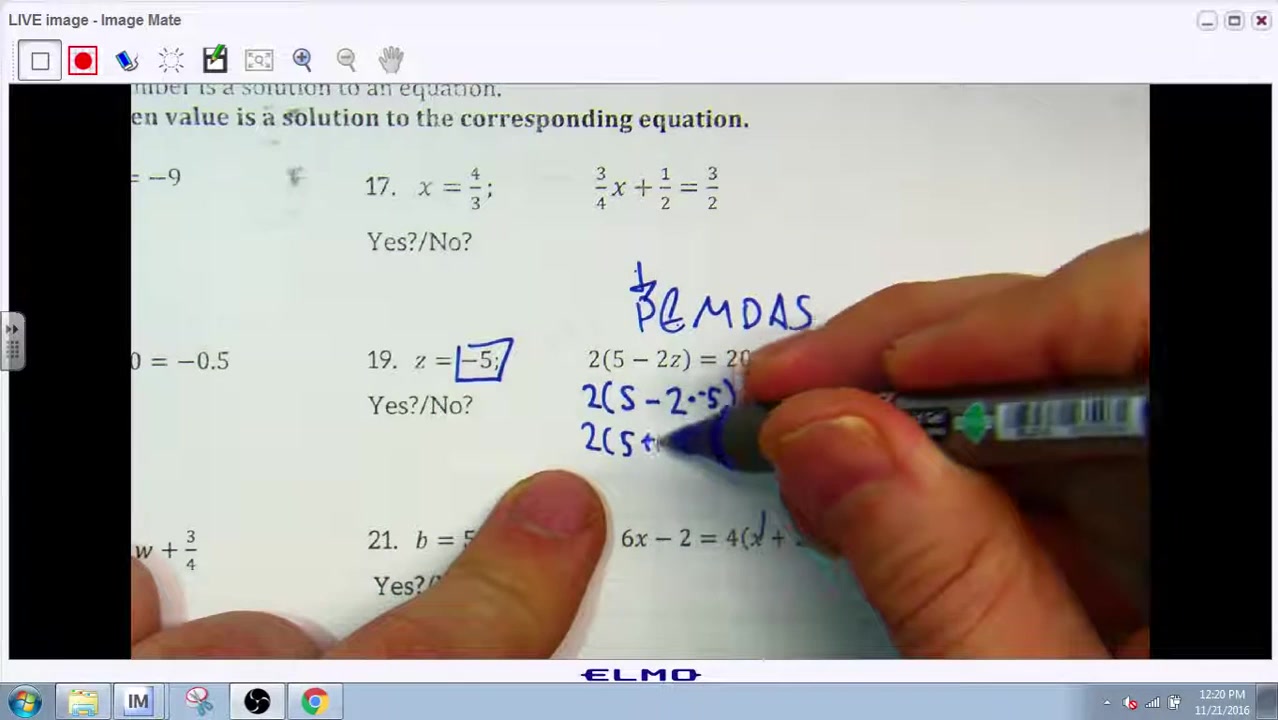
Remember that both terms of the binomial must be divided by the denominator. It is crucial to perform this step correctly.






Most people like





























Report
Please select a reason for reporting
- 13 Reasons to Switch from Snapchat to Text Messaging
- 7 Powerful Speech to Text Apps to Boost Productivity
- 10 Best Speech to Text Tools for Effortless Transcription
- 13 Free Tools to Easily Transcribe Audio to Text
- 15 Surprising Ways Google's Speech-to-Text Boosts Productivity
- 7 Best Free Online Audio to Text Transcription Tools
- 9 Tips to Transcribe Speech to Text Faster and Better
- 13 Best Speech to Text Software for Windows 10 in 2023
- 7 Tips for Choosing the Best Transcriber for Audio to Text
- 11 Reasons Why Dragon Speech-to-Text Apps are Game-Changers
- 6 Secrets to Enhance Your Speech to Text Transcription
- 6 Brilliant Ways to Boost Productivity with Talk-to-Text on Your MacBook
- 6 Ways Transcription Software Converts Audio to Text
- 8 Tips to Transcribe Speech to Text Like a Pro
- 6 Reasons IBM Watson Speech to Text is a Game-Changer
- 14 Powerful Ways Talk-to-Text Improves Your Workflow
- 12 Top Windows Speech-to-Text Software for Efficient Transcription
- 12 Game-Changing Benefits of Apple's Speech to Text Technology
- 9 Powerful Use Cases for AWS Speech to Text Technology
- 10 Easy Steps to Transcribe YouTube Videos to Text
- transcription audio en texte
- online audio transcription
- free audio file transcription
- free ai audio transcription
- audio transcription service
- audio transcription online free
- audio transcription free online
- audio to transcription software
- audio and transcript
- ai audio transcription free
- voice recording to text converter
- translate voice recording to text
- record voice to text
- audio recording to text converter
- voice recording and transcription
- chatgpt voice to text
- gmail voice to text
- speech to text reader
- speech to text ai free
- speech to talk
- Design Professional Flyers for Free on Your Phone
- Best Free Flyer Maker Apps for Android: Design Like a Pro
- How to Know If Your Business Is Ready for an AI Customer Service Agent
- Revolutionizing Storytelling: From Novels to Screenplays with AI
- Create Engaging Animated Explainer Videos with a Free AI Tool
- Stop Multi-Subscribing: Benchmark Top AI Visual Models in One Canvas
- Best Seedance 2.5 API Provider: Every Price on the Market, Checked at Source
- AI OnlyFans: How to Generate $30,000/Month (Legally)
- Transform Your Script into an Engaging Video with AI Video Maker!
- AI Marketing Automation: A Comprehensive Guide for Small Businesses
- Design Professional Flyers for Free on Your Phone
- Best Free Flyer Maker Apps for Android: Design Like a Pro
- Unleash Creativity: AI Coloring Pages with ColoringBook.ai
- Generate Stunning AI Photos with Google Gemini: A Guide
- Boost Your Etsy Sales with Stunning Digital Invitations!
- Revolutionize Your Etsy Listing with AI Text Generator
- Create Coloring Pages with AI: A Bing AI Tutorial
- Photo Lab App: Transform Your Photos with Stunning AI Effects
- Effortless Design: Rewriting Text with Microsoft Designer's AI
- Create & Sell Kids' Coloring Books with AI - KDP Guide

Copyright ©2026 toolify