































Table of Contents
- Key Points
- Introduction to Pivot Tables and AI in Excel
- Creating Pivot Tables with Microsoft Copilot: A Step-by-Step Guide
- Microsoft Copilot: Subscription Details
- Advantages and Disadvantages of Using Microsoft Copilot for Pivot Tables
- Core Features of Microsoft Copilot in Excel
- Use Cases: How Copilot Can Transform Your Excel Experience
- Frequently Asked Questions about Microsoft Copilot and Pivot Tables
- Related Questions: Dive Deeper into Data Analysis with Excel and AI


Introduction to Pivot Tables and AI in Excel
The Power of Pivot Tables
Pivot tables are an essential feature in Microsoft Excel for anyone working with data. They allow users to quickly summarize large datasets, extract meaningful insights, and generate reports with just a few clicks. By rearranging data into different perspectives, pivot tables reveal hidden trends and patterns that might otherwise go unnoticed. This capability is invaluable for data-driven decision-making across various industries.
Key capabilities of pivot tables include:
- Summarization: Condensing large datasets into manageable summaries.
- Aggregation: Calculating sums, averages, counts, and other statistics.
- Filtering: Focusing on specific subsets of data.
- Grouping: Categorizing data based on criteria you define.
- Report Generation: Creating dynamic and interactive reports.
Traditional pivot table creation involves manually selecting data ranges, choosing fields for rows, columns, and values, and configuring aggregation functions. This process can be time-consuming and may require significant Excel proficiency. However, with the advent of AI-powered tools like Microsoft Copilot, this process is becoming significantly easier.
Microsoft Copilot: Your AI Assistant in Excel
Microsoft Copilot is an AI companion designed to enhance productivity across Microsoft 365 applications, including Excel, WORD, and PowerPoint.
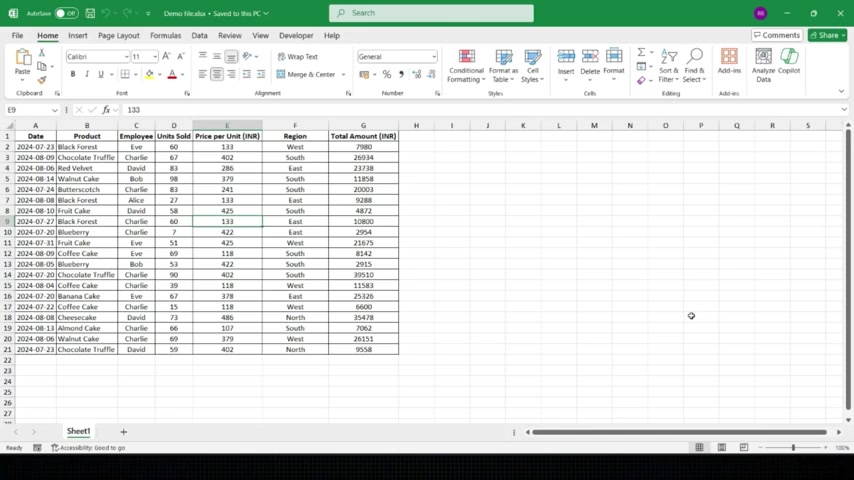
In Excel, Copilot uses natural language processing and machine learning to understand your data and provide intelligent assistance. It can analyze data, suggest formulas, create charts, and, most importantly, generate pivot tables based on simple text prompts.
Copilot's capabilities in Excel include:
- Data Analysis: Identifying trends, patterns, and outliers in your data.
- Formula Suggestions: Recommending appropriate formulas based on your data and desired calculations.
- Chart Creation: Automatically generating visualizations to represent your data effectively.
- Pivot Table Generation: Creating pivot tables from text prompts, eliminating manual configuration.
- Insight Explanation: Providing clear explanations of the insights derived from data analysis.
By leveraging Copilot, users can bypass the complexities of traditional pivot table creation and focus on interpreting the results. This accessibility democratizes data analysis, allowing individuals with varying levels of Excel expertise to extract valuable insights.
Creating Pivot Tables with Microsoft Copilot: A Step-by-Step Guide
Accessing Microsoft Copilot in Excel
The first step is ensuring that you have access to Microsoft Copilot.
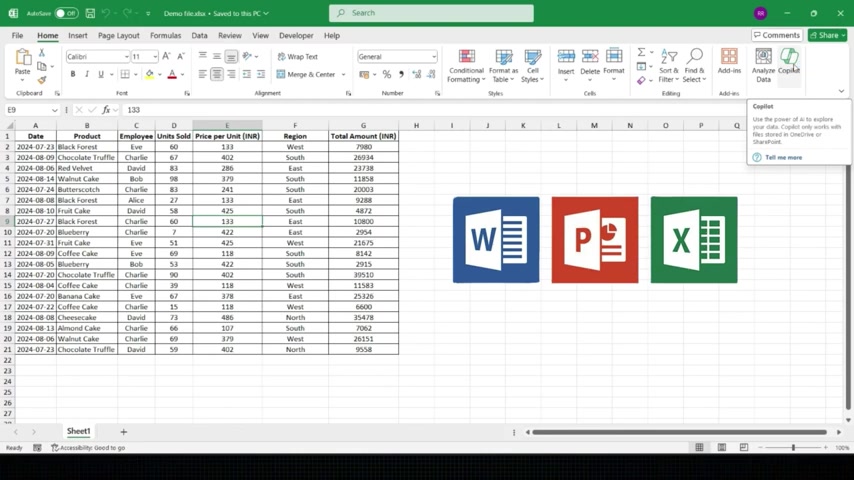
Copilot is a paid AI feature in Microsoft Excel, so you'll need an appropriate subscription. Once you have access, the Copilot icon will be visible within the Excel ribbon.
Steps to access Copilot:
- Open Microsoft Excel.
- Open an Excel file with your data.
- Look for the Copilot icon in the Excel ribbon, typically located on the right-hand side.
- Click the Copilot icon to open the Copilot panel.
Once the Copilot panel is open, you're ready to begin using AI to create pivot tables.
Using Text Prompts to Generate Pivot Tables
Copilot uses text prompts to understand your analysis requirements.
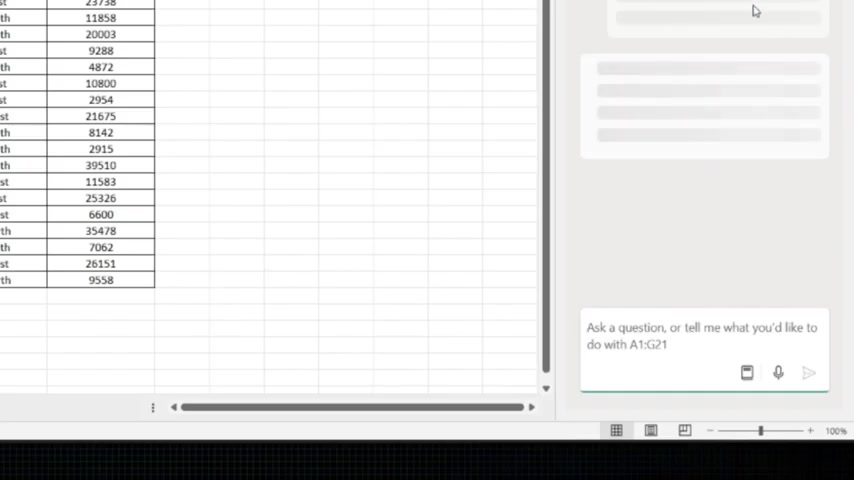
You can enter prompts in the Copilot panel to instruct the AI to create specific types of pivot tables.
Example prompts:
- "Give me region-wise sales in terms of total amount in the form of a pivot table"
- "Give me data for top 2 employees who have done maximum sales"
- "Give me the data for total units sold product-wise in the form of a pivot table"
Tips for writing effective prompts:
- Be specific about the data you want to analyze.
- Clearly state the desired output format (e.g., pivot table).
- Use natural language that Copilot can easily understand.
- Include keywords related to your data and analysis goals.
After entering your Prompt, press the send button. Copilot will analyze your data and generate a pivot table based on your instructions. This significantly simplifies the traditional process.
Reviewing and Refining Copilot's Output
After Copilot generates the pivot table, take a moment to review the output.
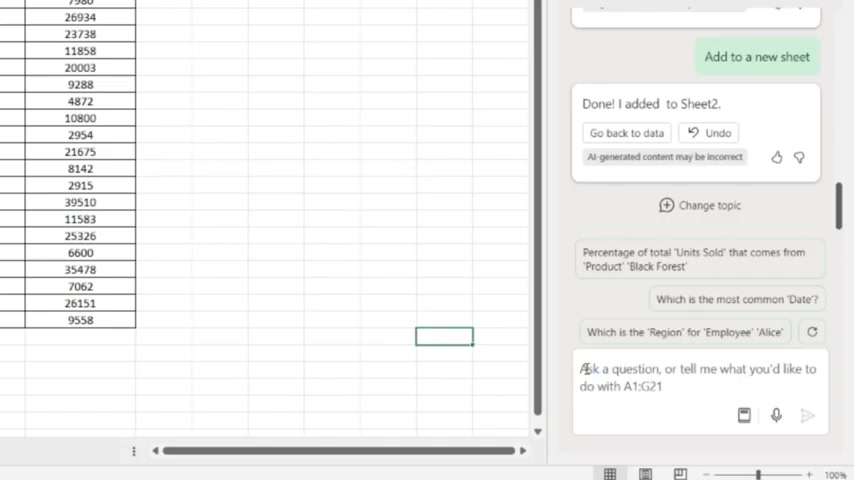
Copilot also provides a summary of the analysis, explaining the insights derived from the data. If the initial pivot table doesn't perfectly match your requirements, you can refine your prompt and ask Copilot to regenerate the output.
Refining your prompt:
- Add more specific instructions.
- Include or exclude specific fields.
- Modify aggregation functions.
- Request a different chart type.
By iterating on your prompts, you can guide Copilot to create the perfect pivot table for your needs. The AI learns from each interaction to better understand your analysis style.
Adding the Pivot Table to a New Sheet
Once you are satisfied with the pivot table, you can easily add it to a new sheet within your Excel workbook.
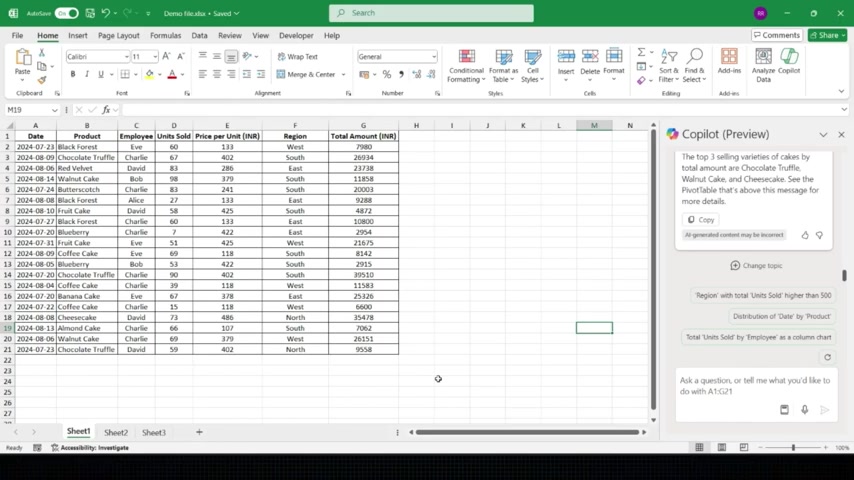
Copilot provides an "Add to a new sheet" button, allowing you to seamlessly integrate the generated pivot table into your workflow.
Steps to add the pivot table to a new sheet:
- Review the generated pivot table in the Copilot panel.
- Click the "Add to a new sheet" button.
The pivot table will be automatically created in a new sheet, ready for further customization or analysis. This feature streamline the whole data analysis process.






Most people like

































Report
Please select a reason for reporting
- 13 Reasons to Switch from Snapchat to Text Messaging
- 7 Powerful Speech to Text Apps to Boost Productivity
- 10 Best Speech to Text Tools for Effortless Transcription
- 13 Free Tools to Easily Transcribe Audio to Text
- 15 Surprising Ways Google's Speech-to-Text Boosts Productivity
- 7 Best Free Online Audio to Text Transcription Tools
- 9 Tips to Transcribe Speech to Text Faster and Better
- 13 Best Speech to Text Software for Windows 10 in 2023
- 7 Tips for Choosing the Best Transcriber for Audio to Text
- 11 Reasons Why Dragon Speech-to-Text Apps are Game-Changers
- 6 Secrets to Enhance Your Speech to Text Transcription
- 6 Brilliant Ways to Boost Productivity with Talk-to-Text on Your MacBook
- 6 Ways Transcription Software Converts Audio to Text
- 8 Tips to Transcribe Speech to Text Like a Pro
- 6 Reasons IBM Watson Speech to Text is a Game-Changer
- 14 Powerful Ways Talk-to-Text Improves Your Workflow
- 12 Top Windows Speech-to-Text Software for Efficient Transcription
- 12 Game-Changing Benefits of Apple's Speech to Text Technology
- 9 Powerful Use Cases for AWS Speech to Text Technology
- 10 Easy Steps to Transcribe YouTube Videos to Text
- transcription audio en texte
- online audio transcription
- free audio file transcription
- free ai audio transcription
- audio transcription service
- audio transcription online free
- audio transcription free online
- audio to transcription software
- audio and transcript
- ai audio transcription free
- voice recording to text converter
- translate voice recording to text
- record voice to text
- audio recording to text converter
- voice recording and transcription
- chatgpt voice to text
- gmail voice to text
- speech to text reader
- speech to text ai free
- speech to talk
- How to Use AI Tools to Find Internal Linking Opportunities Across a Business Website
- Discover Your Perfect Haircut with AI Hairstyle Apps
- Free Reputation Calculator Tools: How They're Adapting to Score AI Visibility, Not Just Rankings
- Design Professional Flyers for Free on Your Phone
- Best Free Flyer Maker Apps for Android: Design Like a Pro
- How to Know If Your Business Is Ready for an AI Customer Service Agent
- Revolutionizing Storytelling: From Novels to Screenplays with AI
- Create Engaging Animated Explainer Videos with a Free AI Tool
- Stop Multi-Subscribing: Benchmark Top AI Visual Models in One Canvas
- Best Seedance 2.5 API Provider: Every Price on the Market, Checked at Source
- Top AI Social Media Management Tools: Automate Your Content Strategy
- Free AI Text to Video Generator: Create Stunning Videos from Text
- Discover 17 ChatGPT Alternatives: A Comprehensive Comparison
- Character.AI vs. Janitor AI: Which AI Chat Platform Reigns Supreme?
- Top Virtual Assistant Companies in 2026: Reviews, Pricing, and Plans Compared
- Unveiling FaceCheck.ID: Revolutionizing Reverse Image Searches with AI
- 11 Best AI Dialers in 2026: Features, Pricing, Pros and Cons
- How I Direct Consistent AI Clips: A Hands-On Guide to Multi-Model Generation
- A Realistic Review of the Photo Generator Image Tool
- Playwright MCP Server: Automated Web Testing with Agent Mode

Copyright ©2026 toolify