June AI


What is June AI?
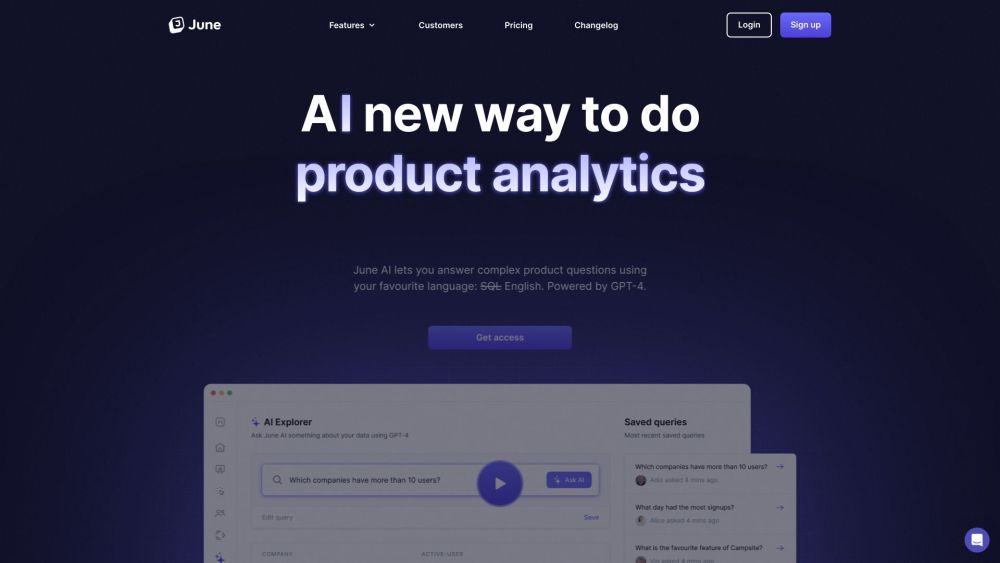
June AI is a product analytics tool designed for B2B SaaS companies. It helps users answer complex product questions using natural language (English), automatically generates reports focused on how companies use their product, and allows users to view and edit the SQL queries behind the reports. June AI aims to provide company-level metrics and insights with zero setup, focusing on acquisition, activation, active users, retention, power users, and churn.
How to use June AI?
Connect a data source (Segment, SDK, or other integrations) to June AI. Then, write a question about your product in English. June AI will return the answer and allow you to view and edit the SQL query. You can also save your queries for future use.
June AI's Core Features
Natural language querying
Auto-generated reports
SQL query viewing and editing
Company-level metrics
Zero setup tracking
Integration with Segment, HubSpot and Attio
June AI's Use Cases
Understanding how companies use your product
Tracking key metrics like acquisition, activation, and retention
Identifying power users and churn
Generating feature release reports
Setting up company and audience alerts
FAQ from June AI
Is June right for me?
Do I really need it?
Will you help me to set it up?
Do you have a startup plan?
June AI Company
June AI Company name: June .
June AI Login
June AI Login Link: https://analytics.june.so/login
June AI Sign up
June AI Sign up Link: https://analytics.june.so/start
June AI Pricing
June AI Pricing Link: https://www.june.so/pricing
June AI Youtube
June AI Youtube Link: https://www.youtube.com/watch?v=q-qfrNYPOkA
June AI Linkedin
June AI Linkedin Link: https://www.linkedin.com/company/juneso
June AI Twitter
June AI Twitter Link: https://twitter.com/JuneDotSo
June AI Reviews (0)
June AI Pricing
All-in-one
Contact for Pricing
Everything you need as a growing B2B SaaS company
For the latest pricing, please visit this link: https://www.june.so/pricing
Analytic of June AI
June AI Website Traffic Analysis
Geography
Top 5 Regions


June AI Launch embeds
Use website badges to drive support from your community for your Toolify Launch. They're easy to embed on your homepage or footer.


Alternative of June AI
 15.44%
June AI Comparisons
More Content About June AI
15 Key Product Analytics Metrics to Track for Success
By Amelia on May 18 2024
Unlock Success: 15 Essential Product Analytics Metrics for Maximum Growth!
Social Listening